Reading and interpreting statistics
Maintenance and Monitoring
Total Queries
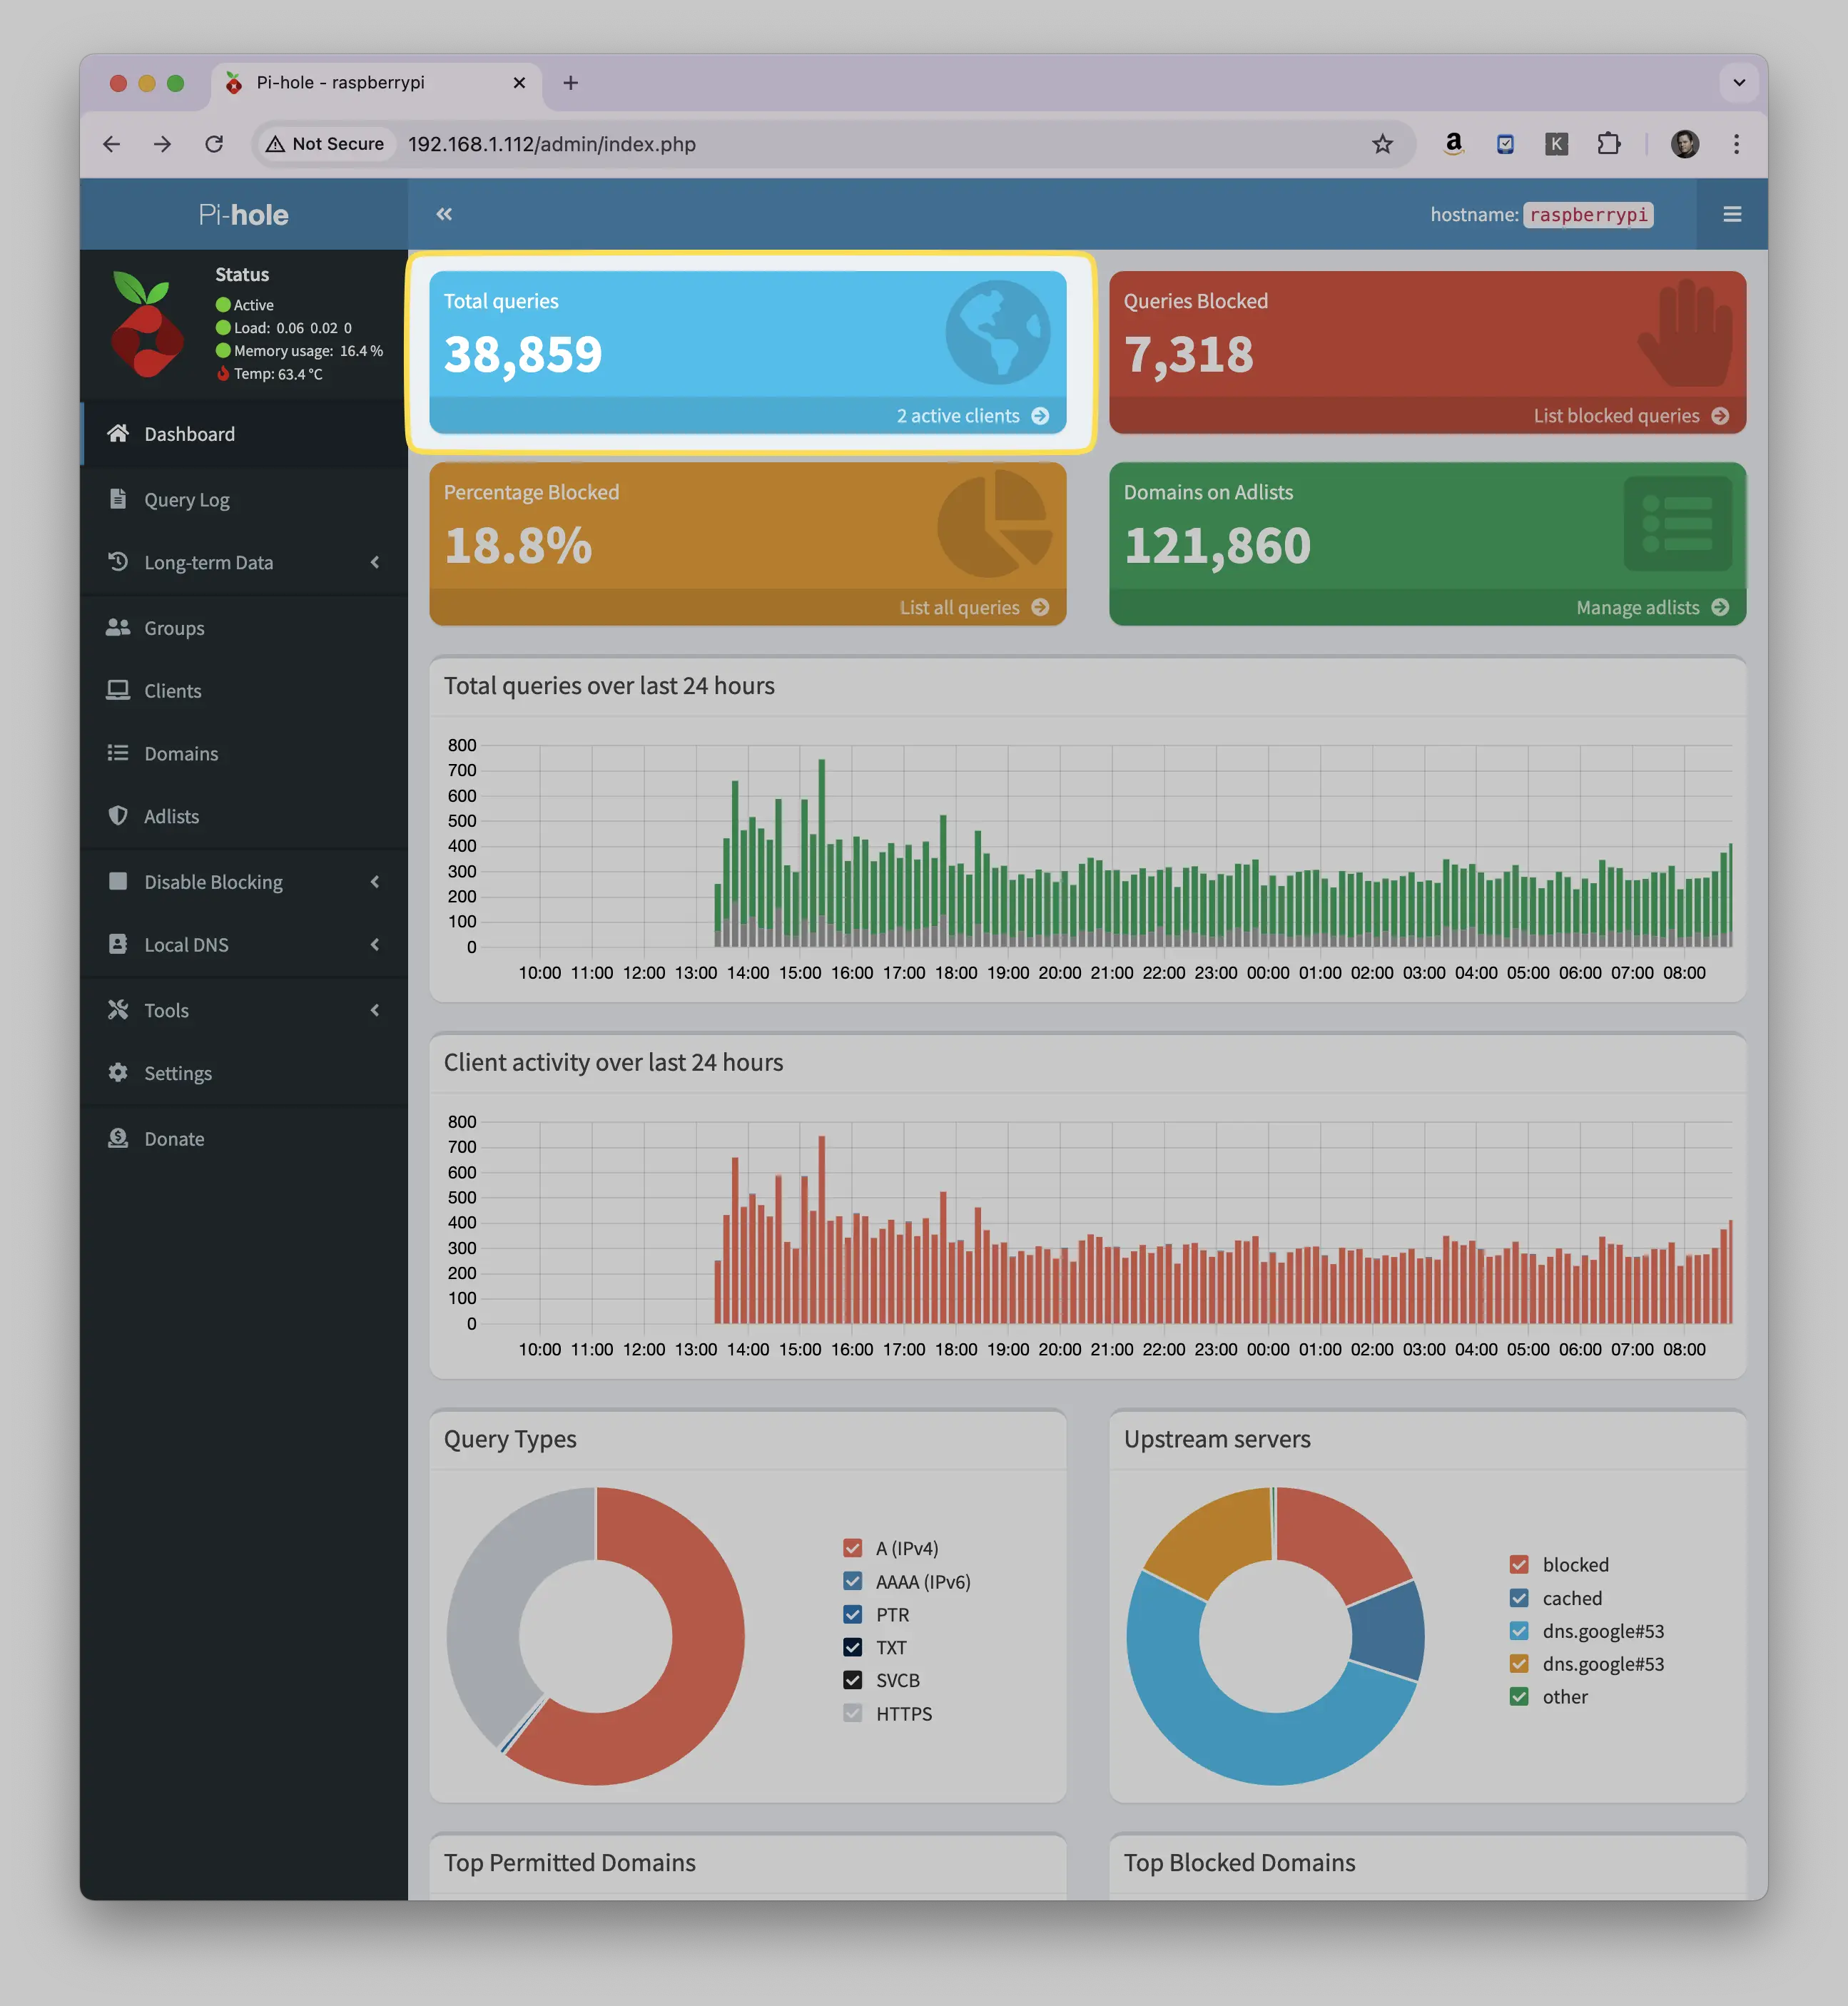
"Total Queries" is the total number of DNS (Domain Name System) requests that have been processed by your Pi-hole server. These queries happen whenever a device on your network tries to access a website or online service.
For example, when you:
- Open a website
- Use an app that connects to the internet
- Receive email
- Watch streaming content
- Use smart home devices
Each of these actions typically generates one or more DNS queries as your devices need to translate domain names (like google.com) into IP addresses that computers can understand. The Total Queries counter shows you how many of these translation requests your Pi-hole has handled.
Queries Blocked
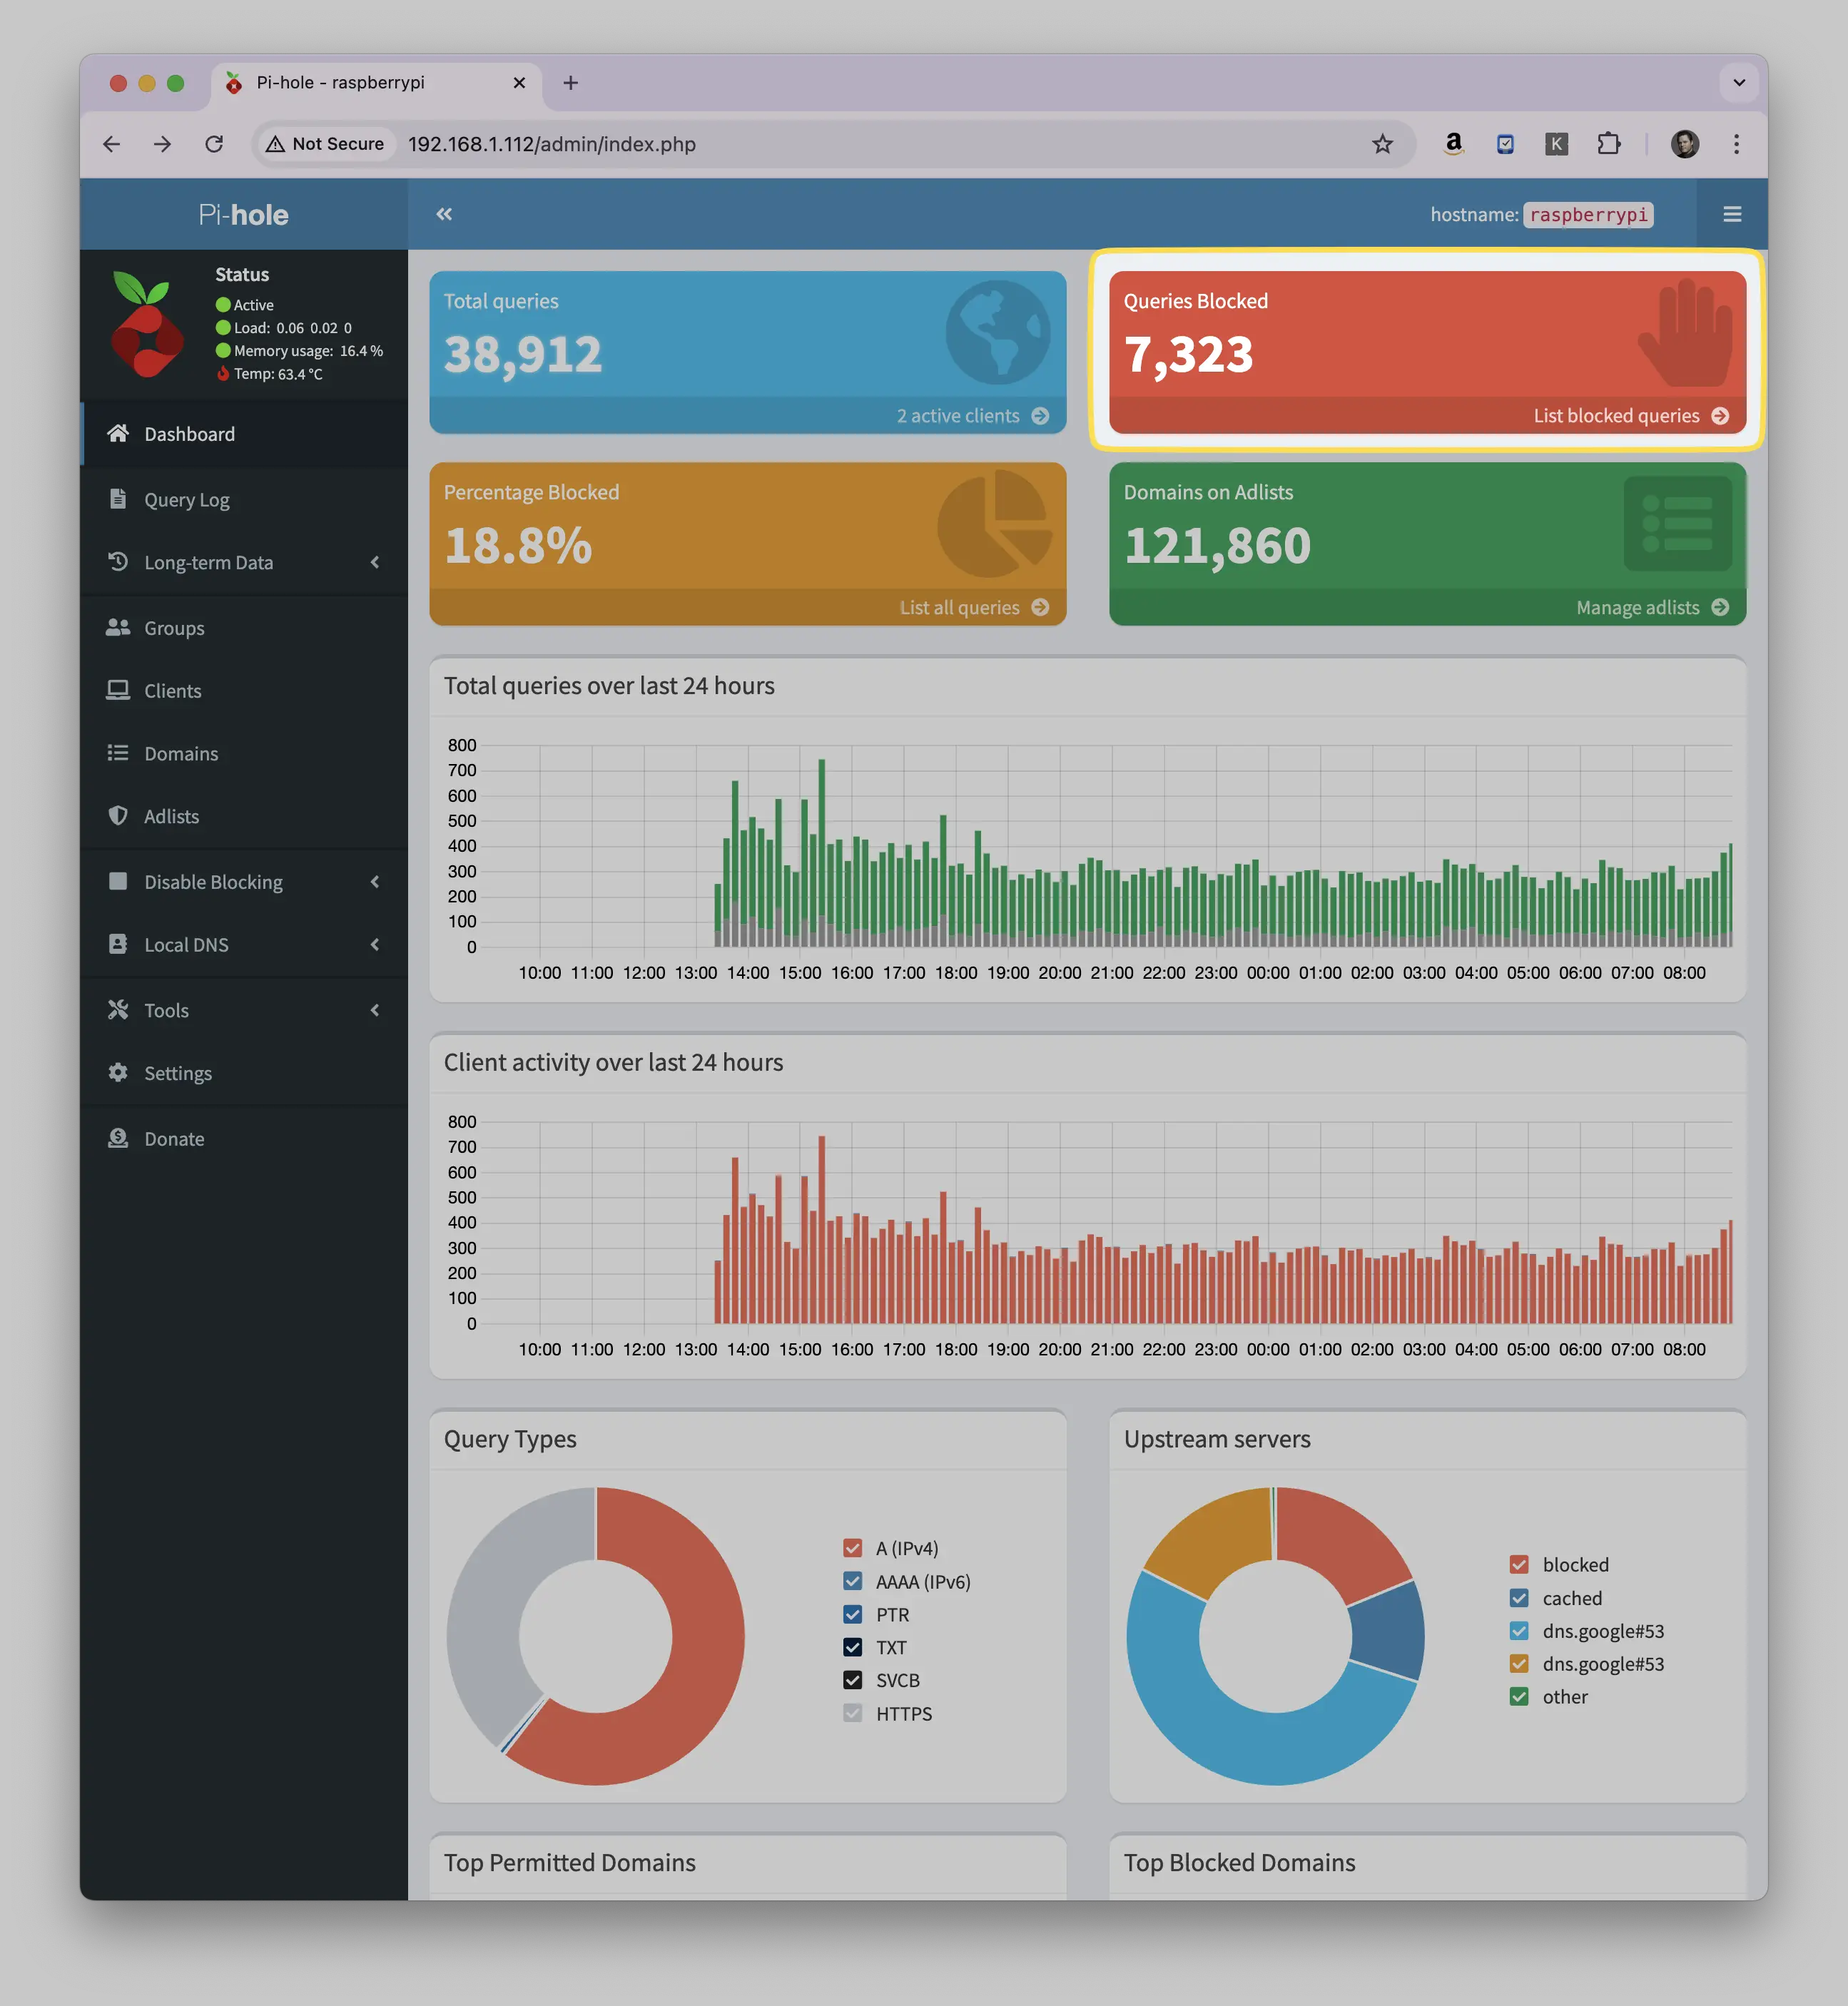
"Queries Blocked"is the number of DNS requests that were blocked because they matched entries in your blocklists. These are typically advertising domains, tracking servers, or other potentially unwanted domains.
When Pi-hole blocks a query, it's essentially preventing your devices from connecting to domains that are known for:
- Serving advertisements
- Tracking user behavior
- Malware distribution
- Telemetry collection
- Other unwanted content
For example, if your device tries to load an ad from "ad-server.example.com" and that domain is in your blocklist, Pi-hole will block that query and add it to your "Queries Blocked" count. This blocking helps reduce unwanted content and can improve your privacy, network performance, and browsing experience.
Percentage Blocked
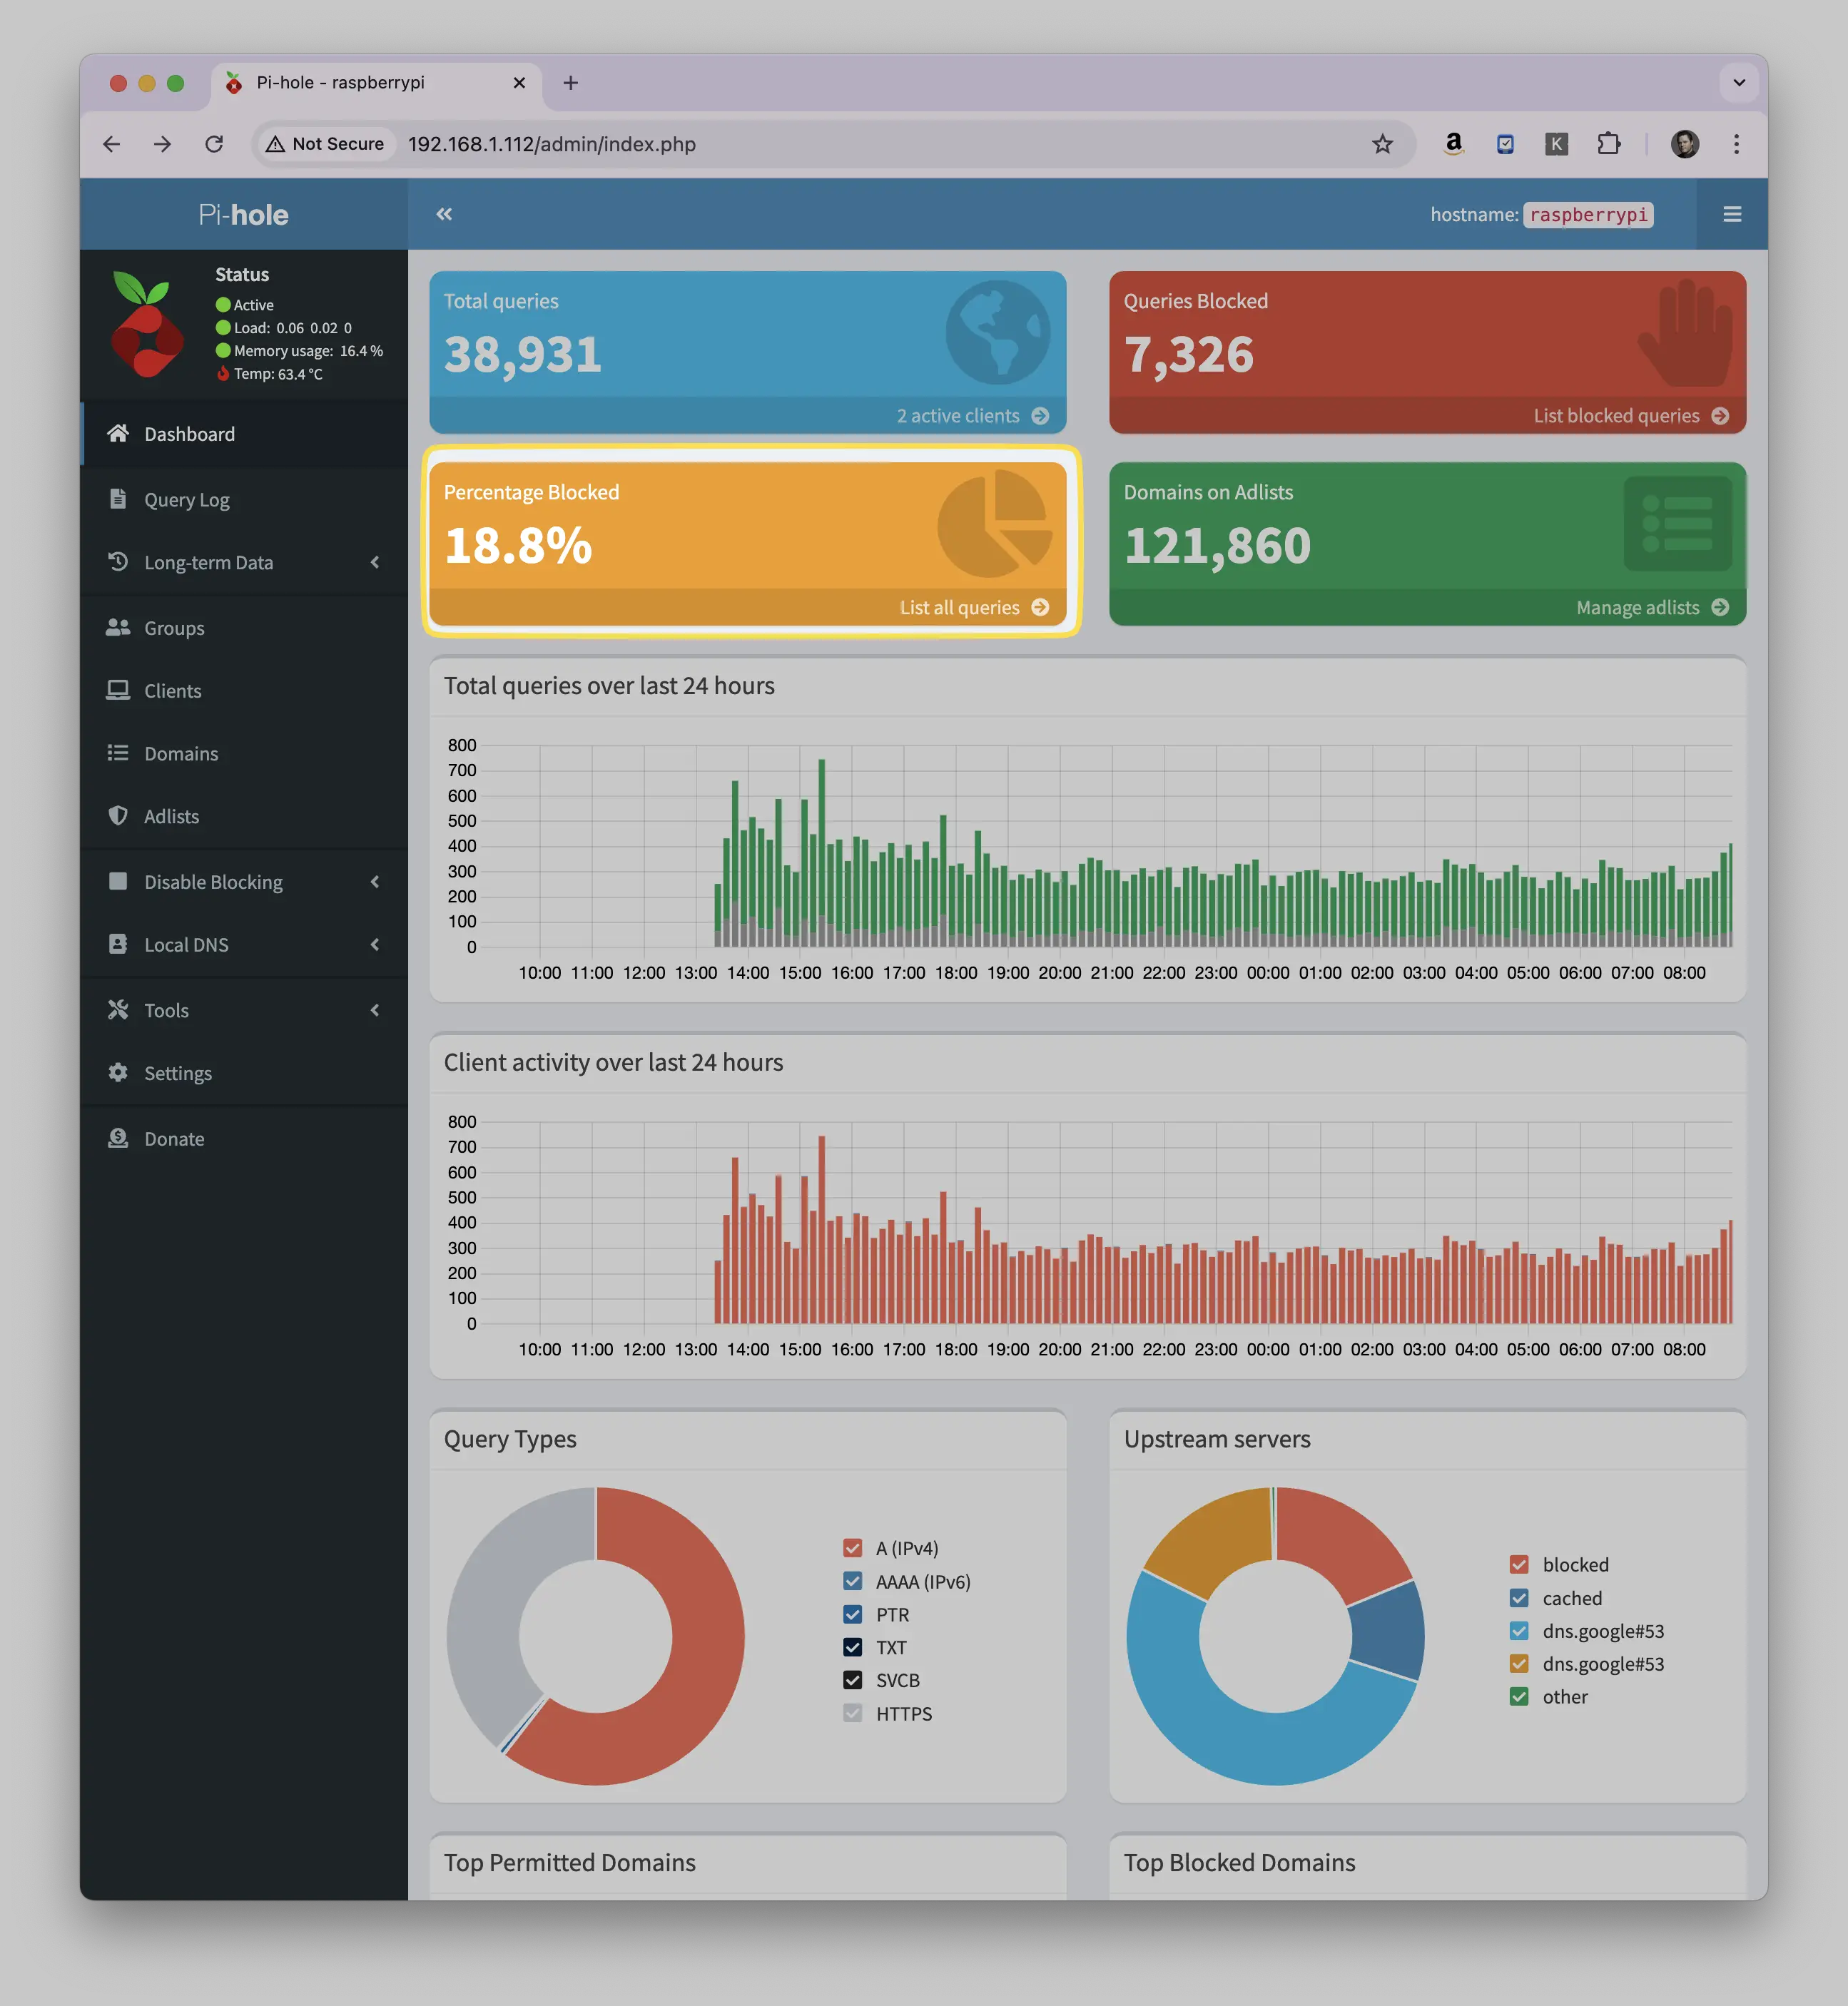
"Percentage Blocked" on Pi-hole shows what portion of all DNS queries were blocked, displayed as a percentage. It's calculated by dividing the number of blocked queries by the total number of queries, then multiplying by 100.
For example:
- If your Pi-hole received 1000 total queries
- And blocked 200 of them
- The Percentage Blocked would be 20%
This percentage helps you understand how effective your Pi-hole is at filtering unwanted content. A typical home network might see blocking percentages anywhere from 10% to 30%, though this can vary significantly based on:
- What blocklists you're using
- What websites and services you frequently access
- How many smart devices you have on your network
- Whether you've added any custom blocklists or whitelist entries
Domains on Adlists
"Domains on Adlists" shows the total number of domain names that Pi-hole has in its blocklists/blacklists. These are the domains that Pi-hole will block if any device tries to connect to them.
These domains come from:
- Default blocklists that come with Pi-hole
- Any additional blocklists you've added manually
- Custom blacklist entries you've created
For example, if you see "1,500,000 Domains on Adlists", it means Pi-hole is checking every DNS query against these 1.5 million known domains that are associated with ads, trackers, or other unwanted content. When a query matches any domain in these lists, it gets blocked.
Query Graphs
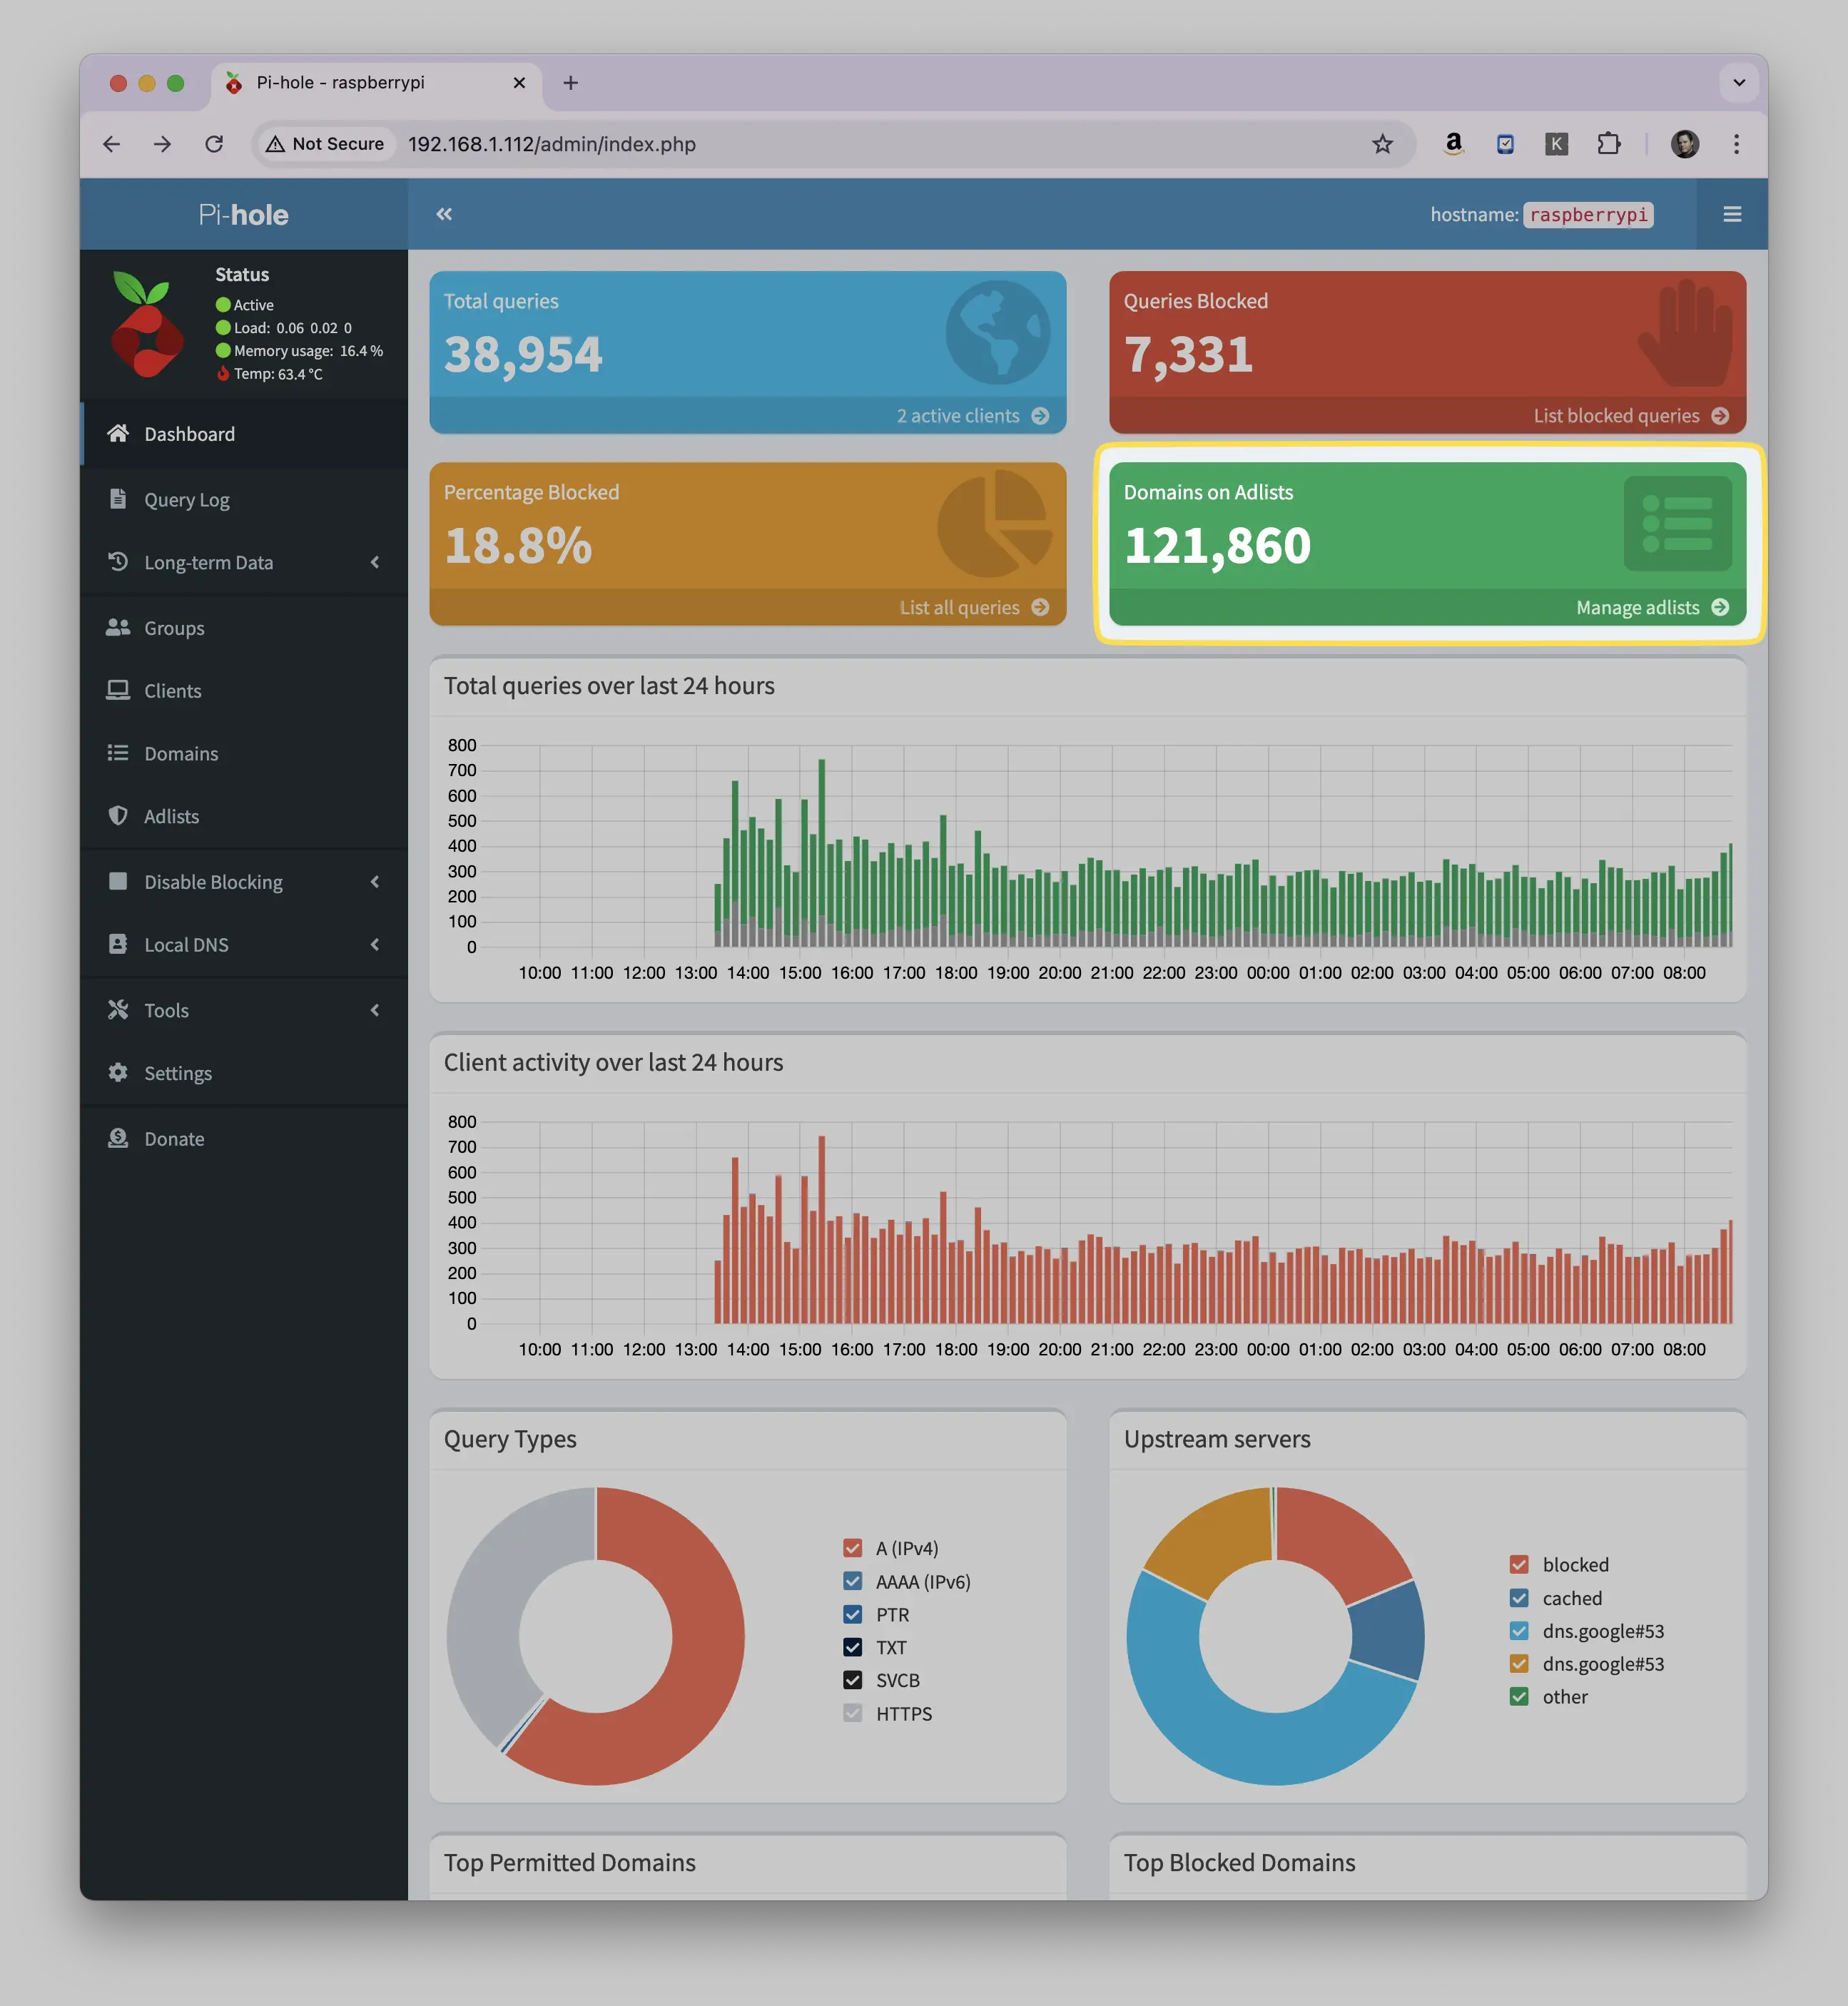
The Query Graphs on Pi-hole show DNS activity patterns over time in two different ways:
"Total queries over last 24 hours":
- Shows you the volume of all DNS requests throughout the day
- Displayed as a line or bar graph with time on the x-axis and number of queries on the y-axis
- Helps you see when your network is most active
- Can help identify unusual spikes in traffic or potential issues
- Usually shows higher activity during waking hours and lower during sleep times
"Client activity over last 24 hours":
- Shows DNS requests from different devices (clients) on your network
- Often color-coded by device
- Helps you see which devices are making the most queries
- Can help identify if any device is making an unusual number of requests
- Useful for spotting devices that might be misbehaving or making excessive requests
These graphs are valuable for:
- Understanding your network usage patterns
- Identifying potential problems
- Monitoring device behavior
- Planning network maintenance windows
Query Types
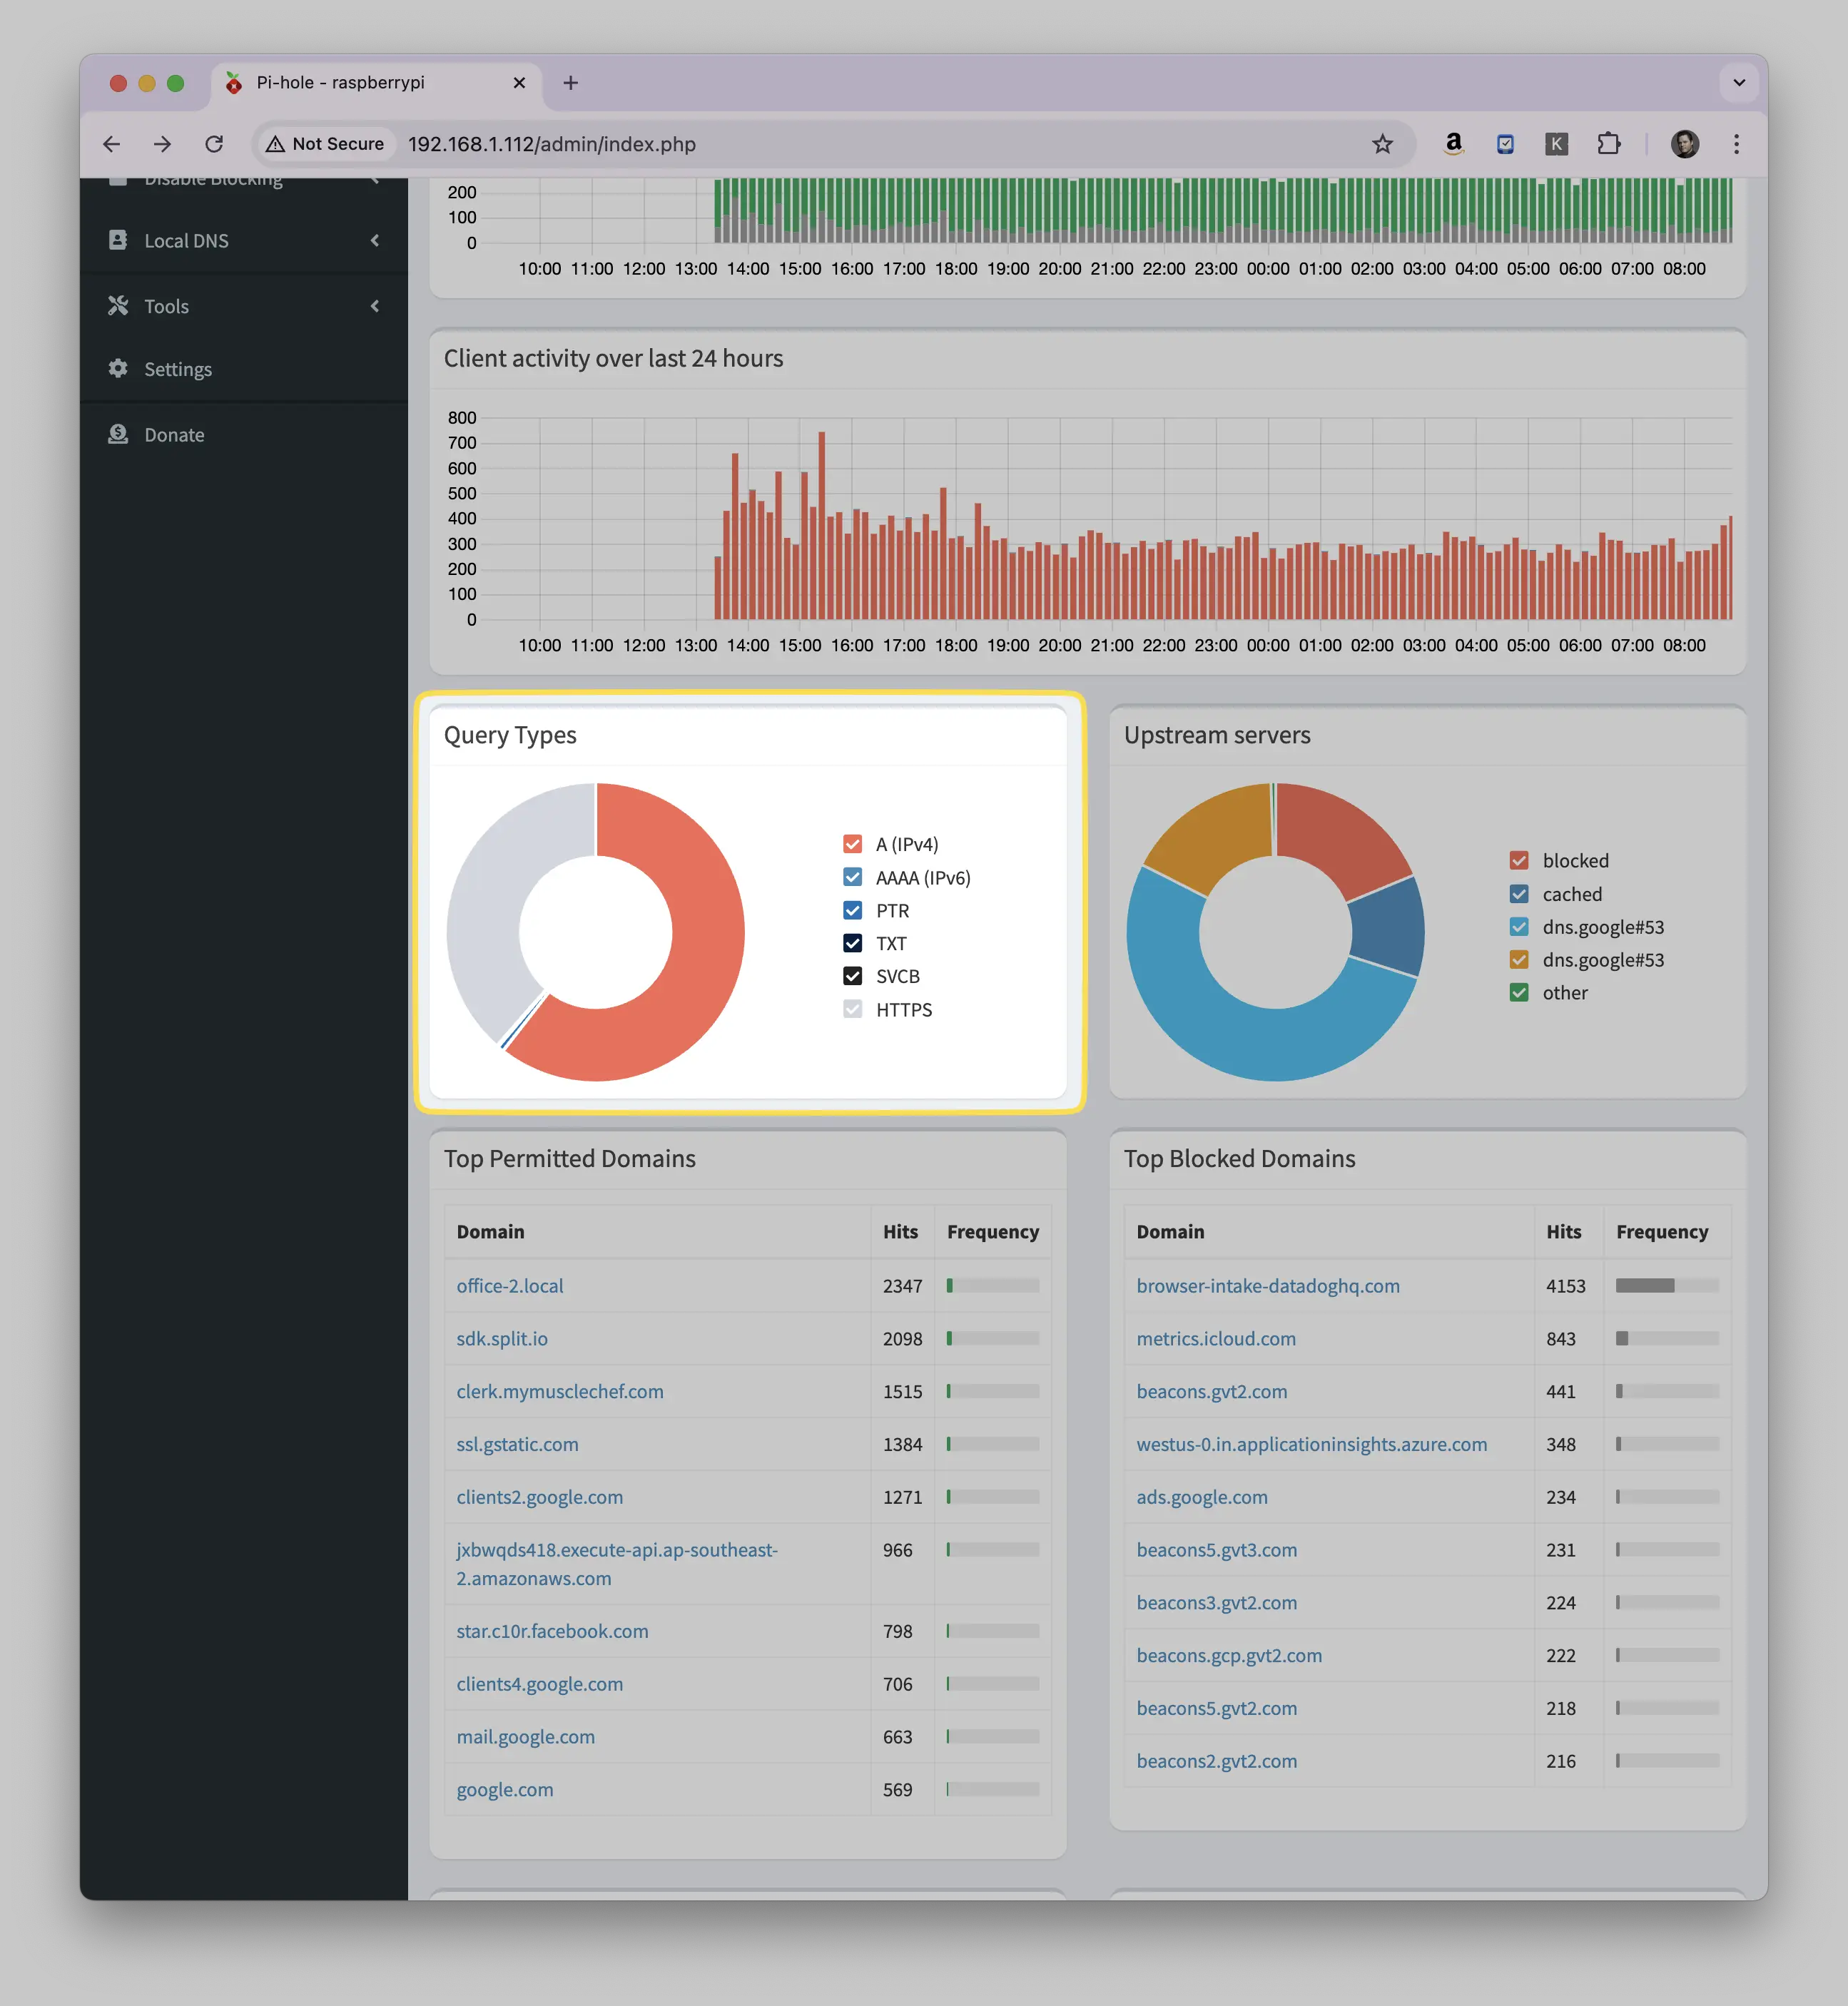
The Query Types donut graph shows the different types of DNS queries being processed by Pi-hole. Let me explain each type:
"A (IPv4)":
- The most common query type
- Used to get the IPv4 address (like 192.168.1.1) for a domain name
- Basic website lookups usually use this
"AAAA (IPv6)":
- Used to get IPv6 addresses (like 2001:0db8:85a3:0000:0000:8a2e:0370:7334)
- Modern networks use these alongside IPv4
- Becoming more common as IPv6 adoption increases
"PTR":
- Pointer records - does reverse DNS lookups
- Converts IP addresses back to domain names
- Often used for network troubleshooting and logging
"TXT":
- Text records
- Contains human-readable text information
- Used for various purposes like email verification (SPF records) or domain ownership verification
"SVCB":
- Service Binding records
- A newer record type
- Helps clients connect to network services more efficiently
"HTTPS":
- Similar to SVCB
- Specifically designed for secure web connections
- Helps browsers know how to securely connect to websites
Upstream Servers
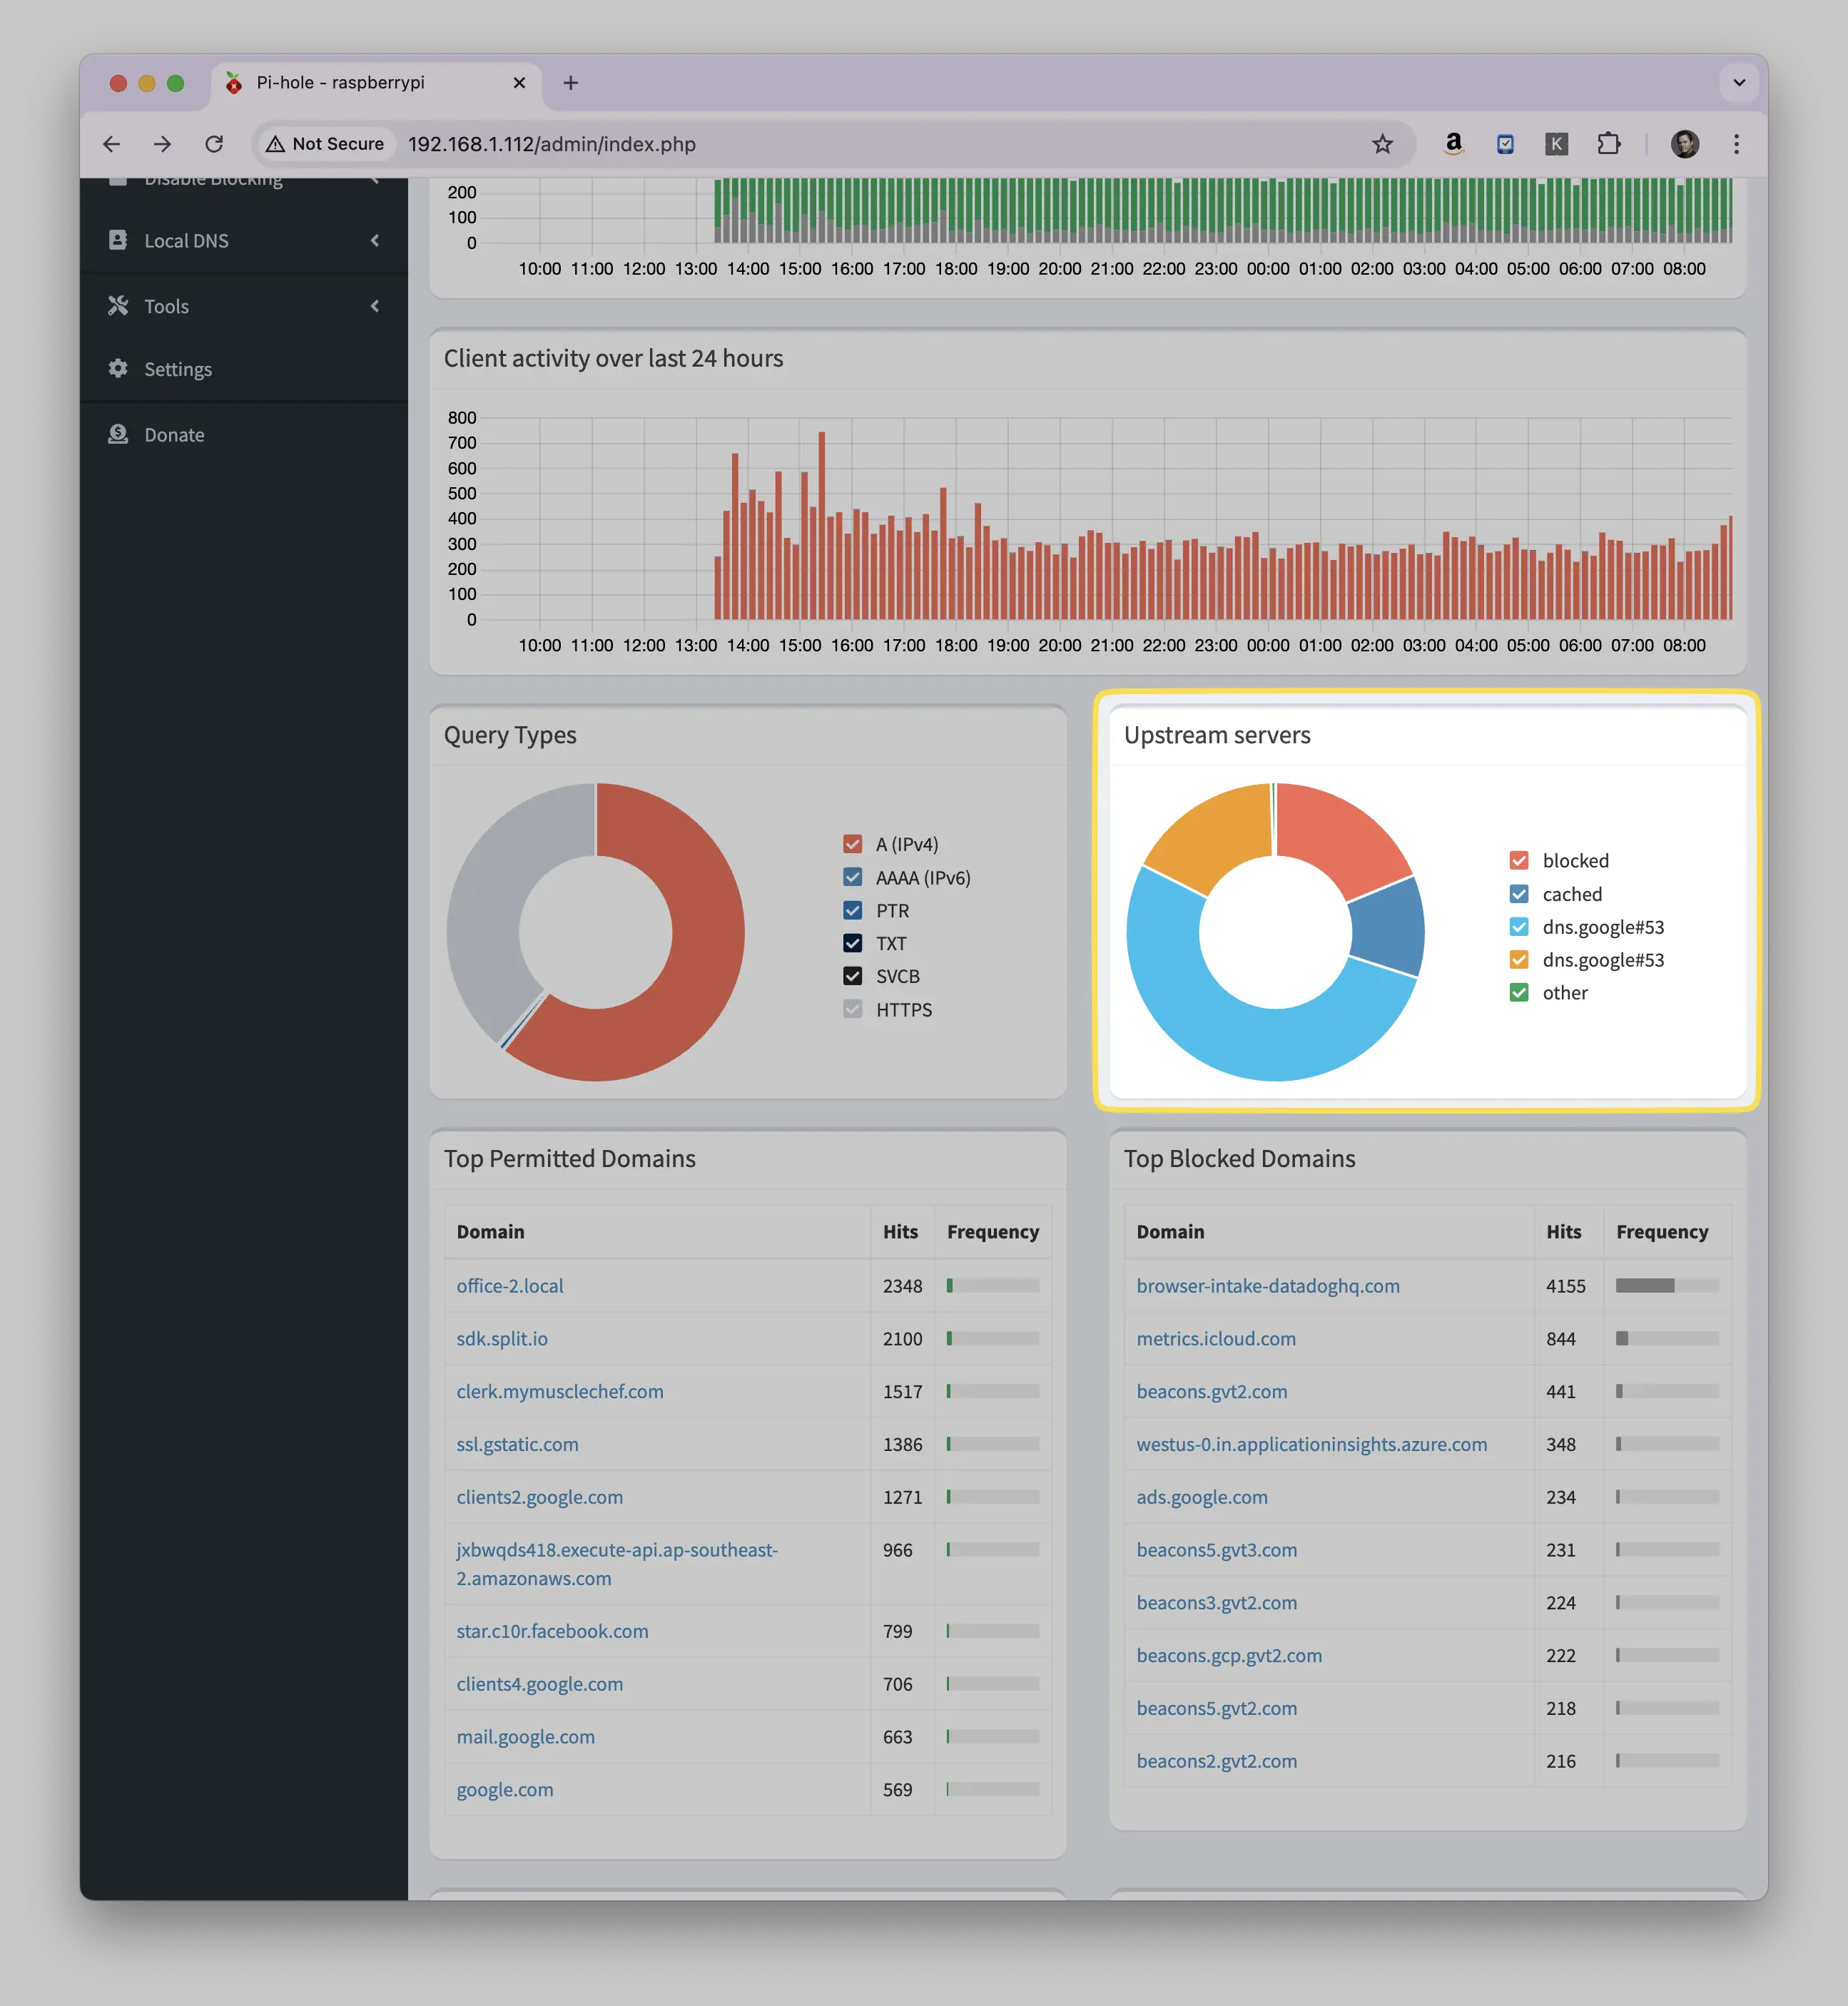
The "Upstream Servers" donut chart shows which DNS servers Pi-hole is forwarding queries to after it processes them. These are the servers that actually resolve DNS queries that aren't blocked.
Common upstream servers you might see:
- "Google (8.8.8.8)" or "Google (8.8.4.4)":
- Google's public DNS servers
- Known for reliability and speed
- "Cloudflare (1.1.1.1)":
- Cloudflare's public DNS service
- Emphasizes privacy and speed
- "Quad9 (9.9.9.9)":
- Security-focused DNS service
- Includes threat blocking
- "OpenDNS":
- Cisco's DNS service
- Offers additional filtering options
- "Local/Custom":
- Could be your router's DNS
- Or other custom DNS servers you've configured
- "Cache":
- Shows queries answered from Pi-hole's local cache
- Faster because no upstream query needed
The chart helps you understand how your DNS queries are being distributed among these different upstream providers.
Top Permitted Domains
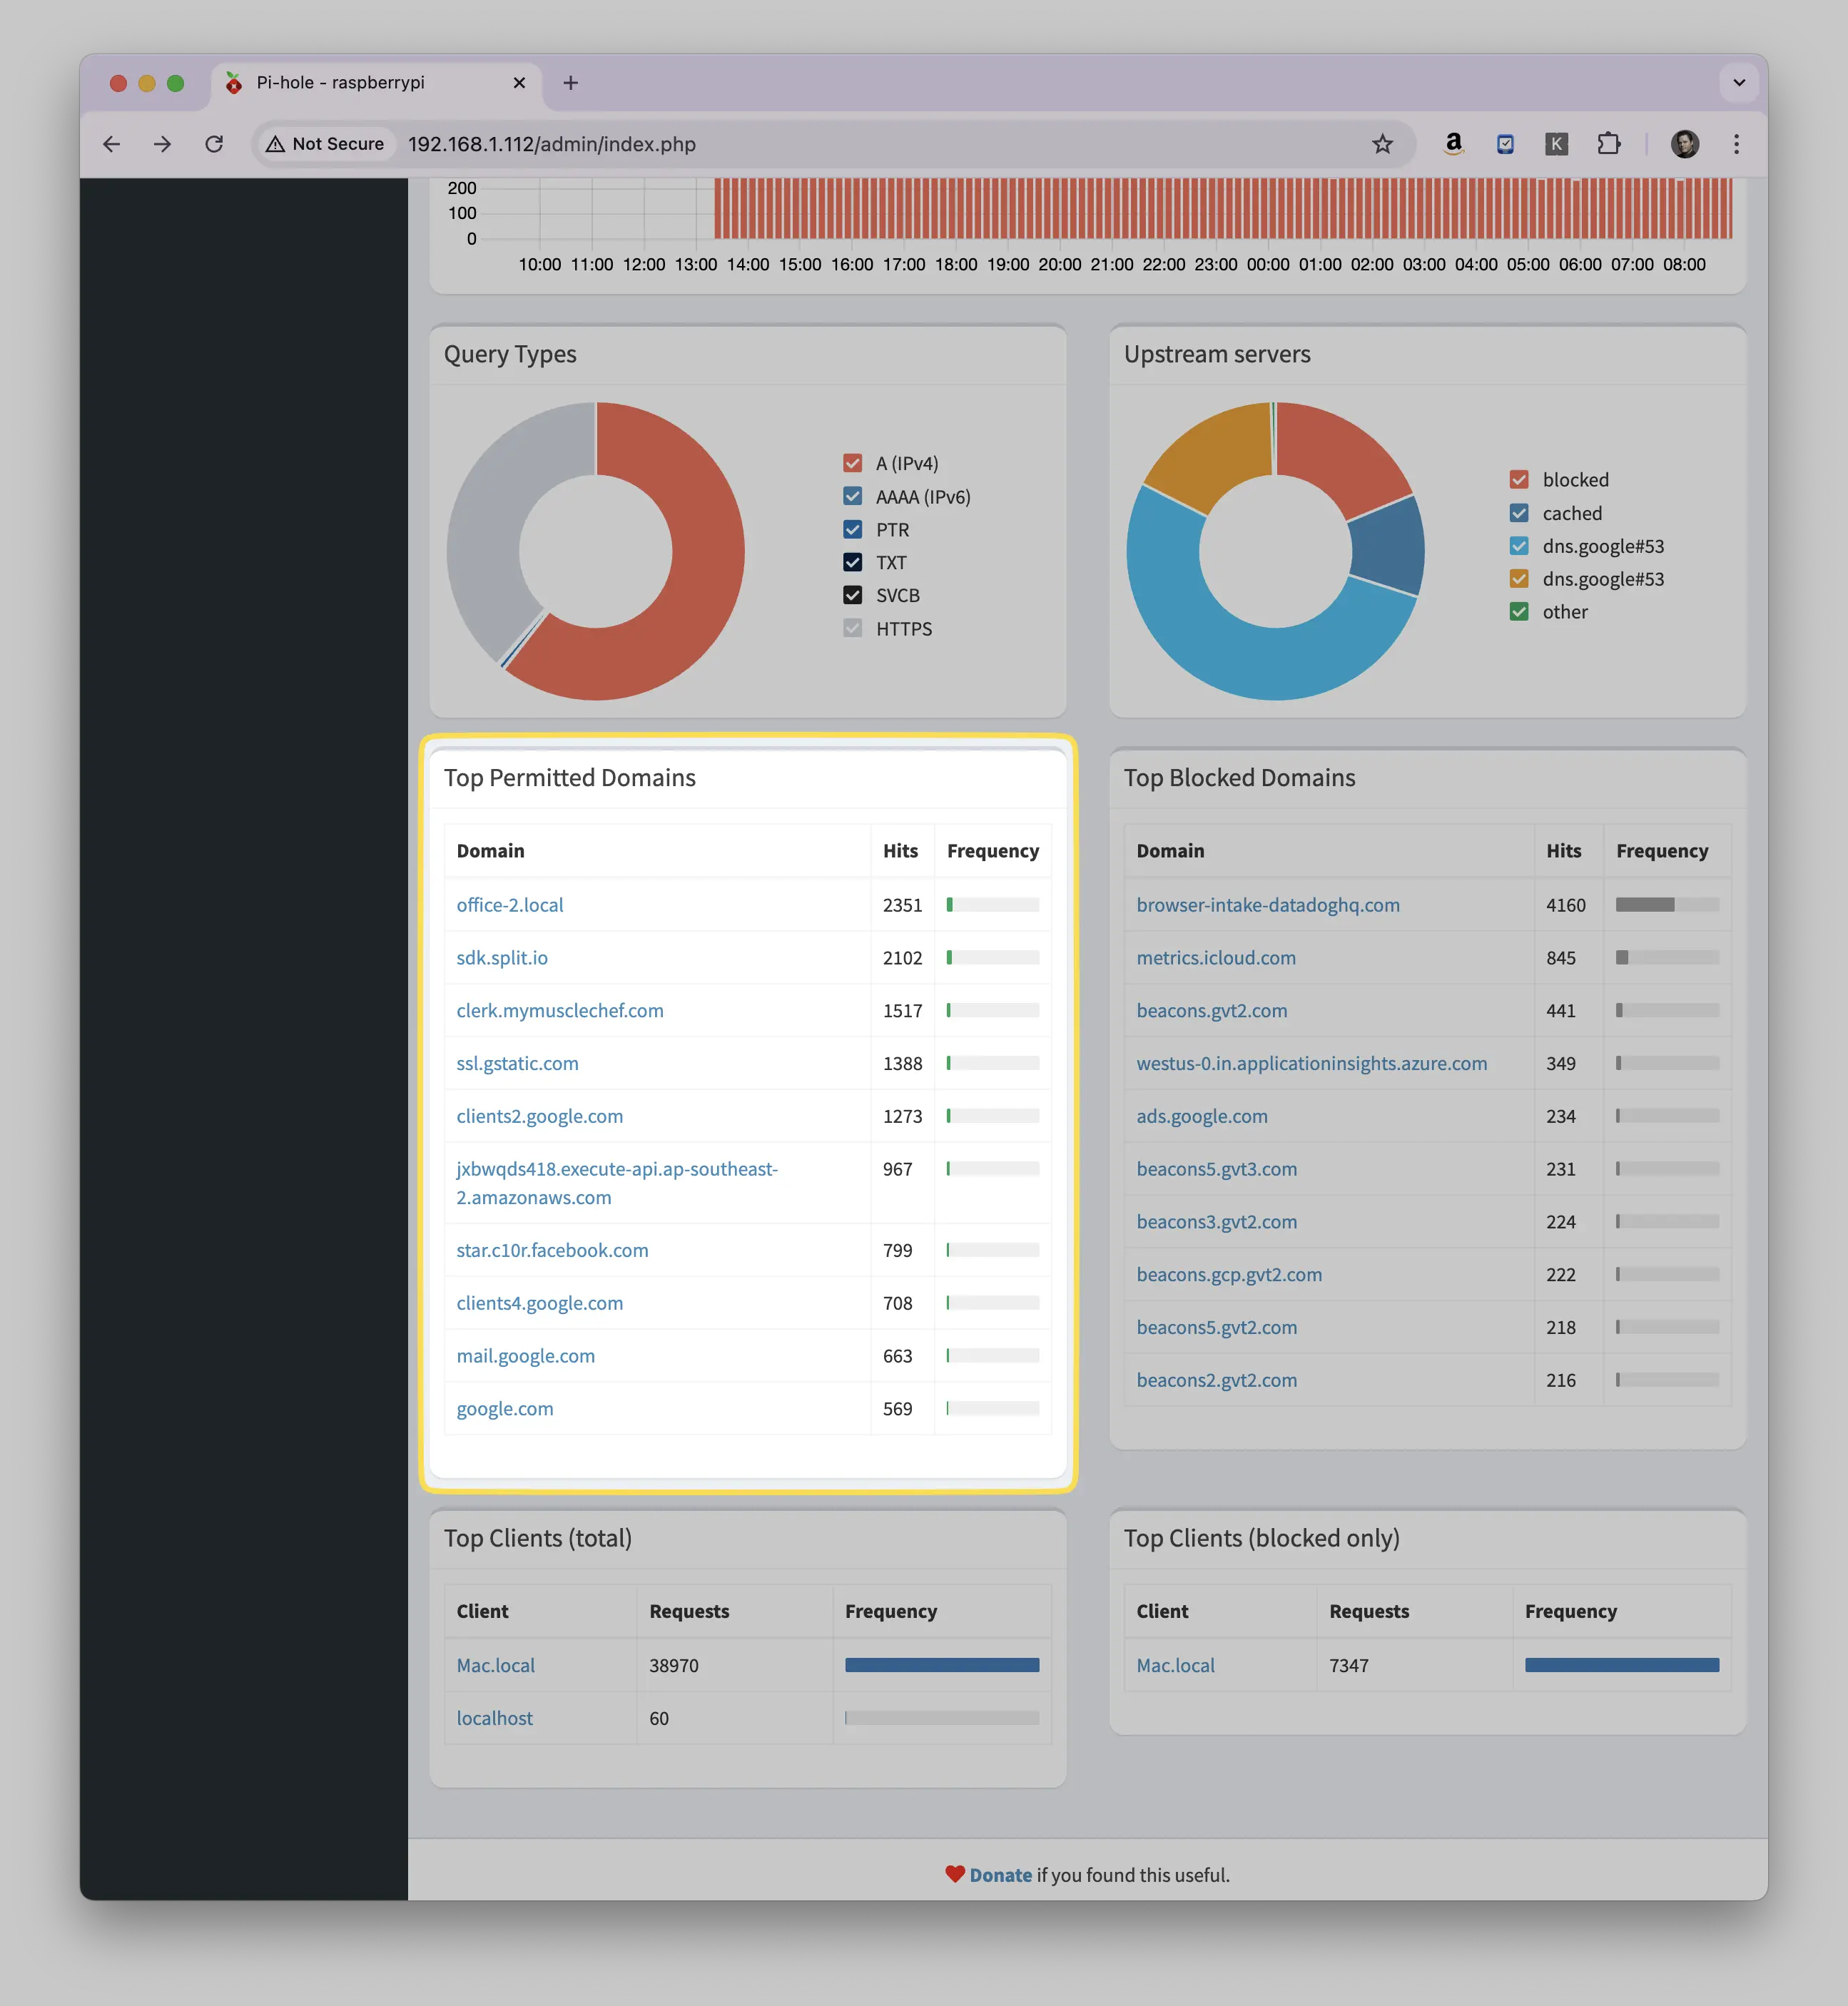
The "Top Permitted Domains" list shows the domain names that were most frequently allowed (not blocked) through your Pi-hole. These are legitimate domains that devices on your network are regularly accessing.
Top Blocked Domains
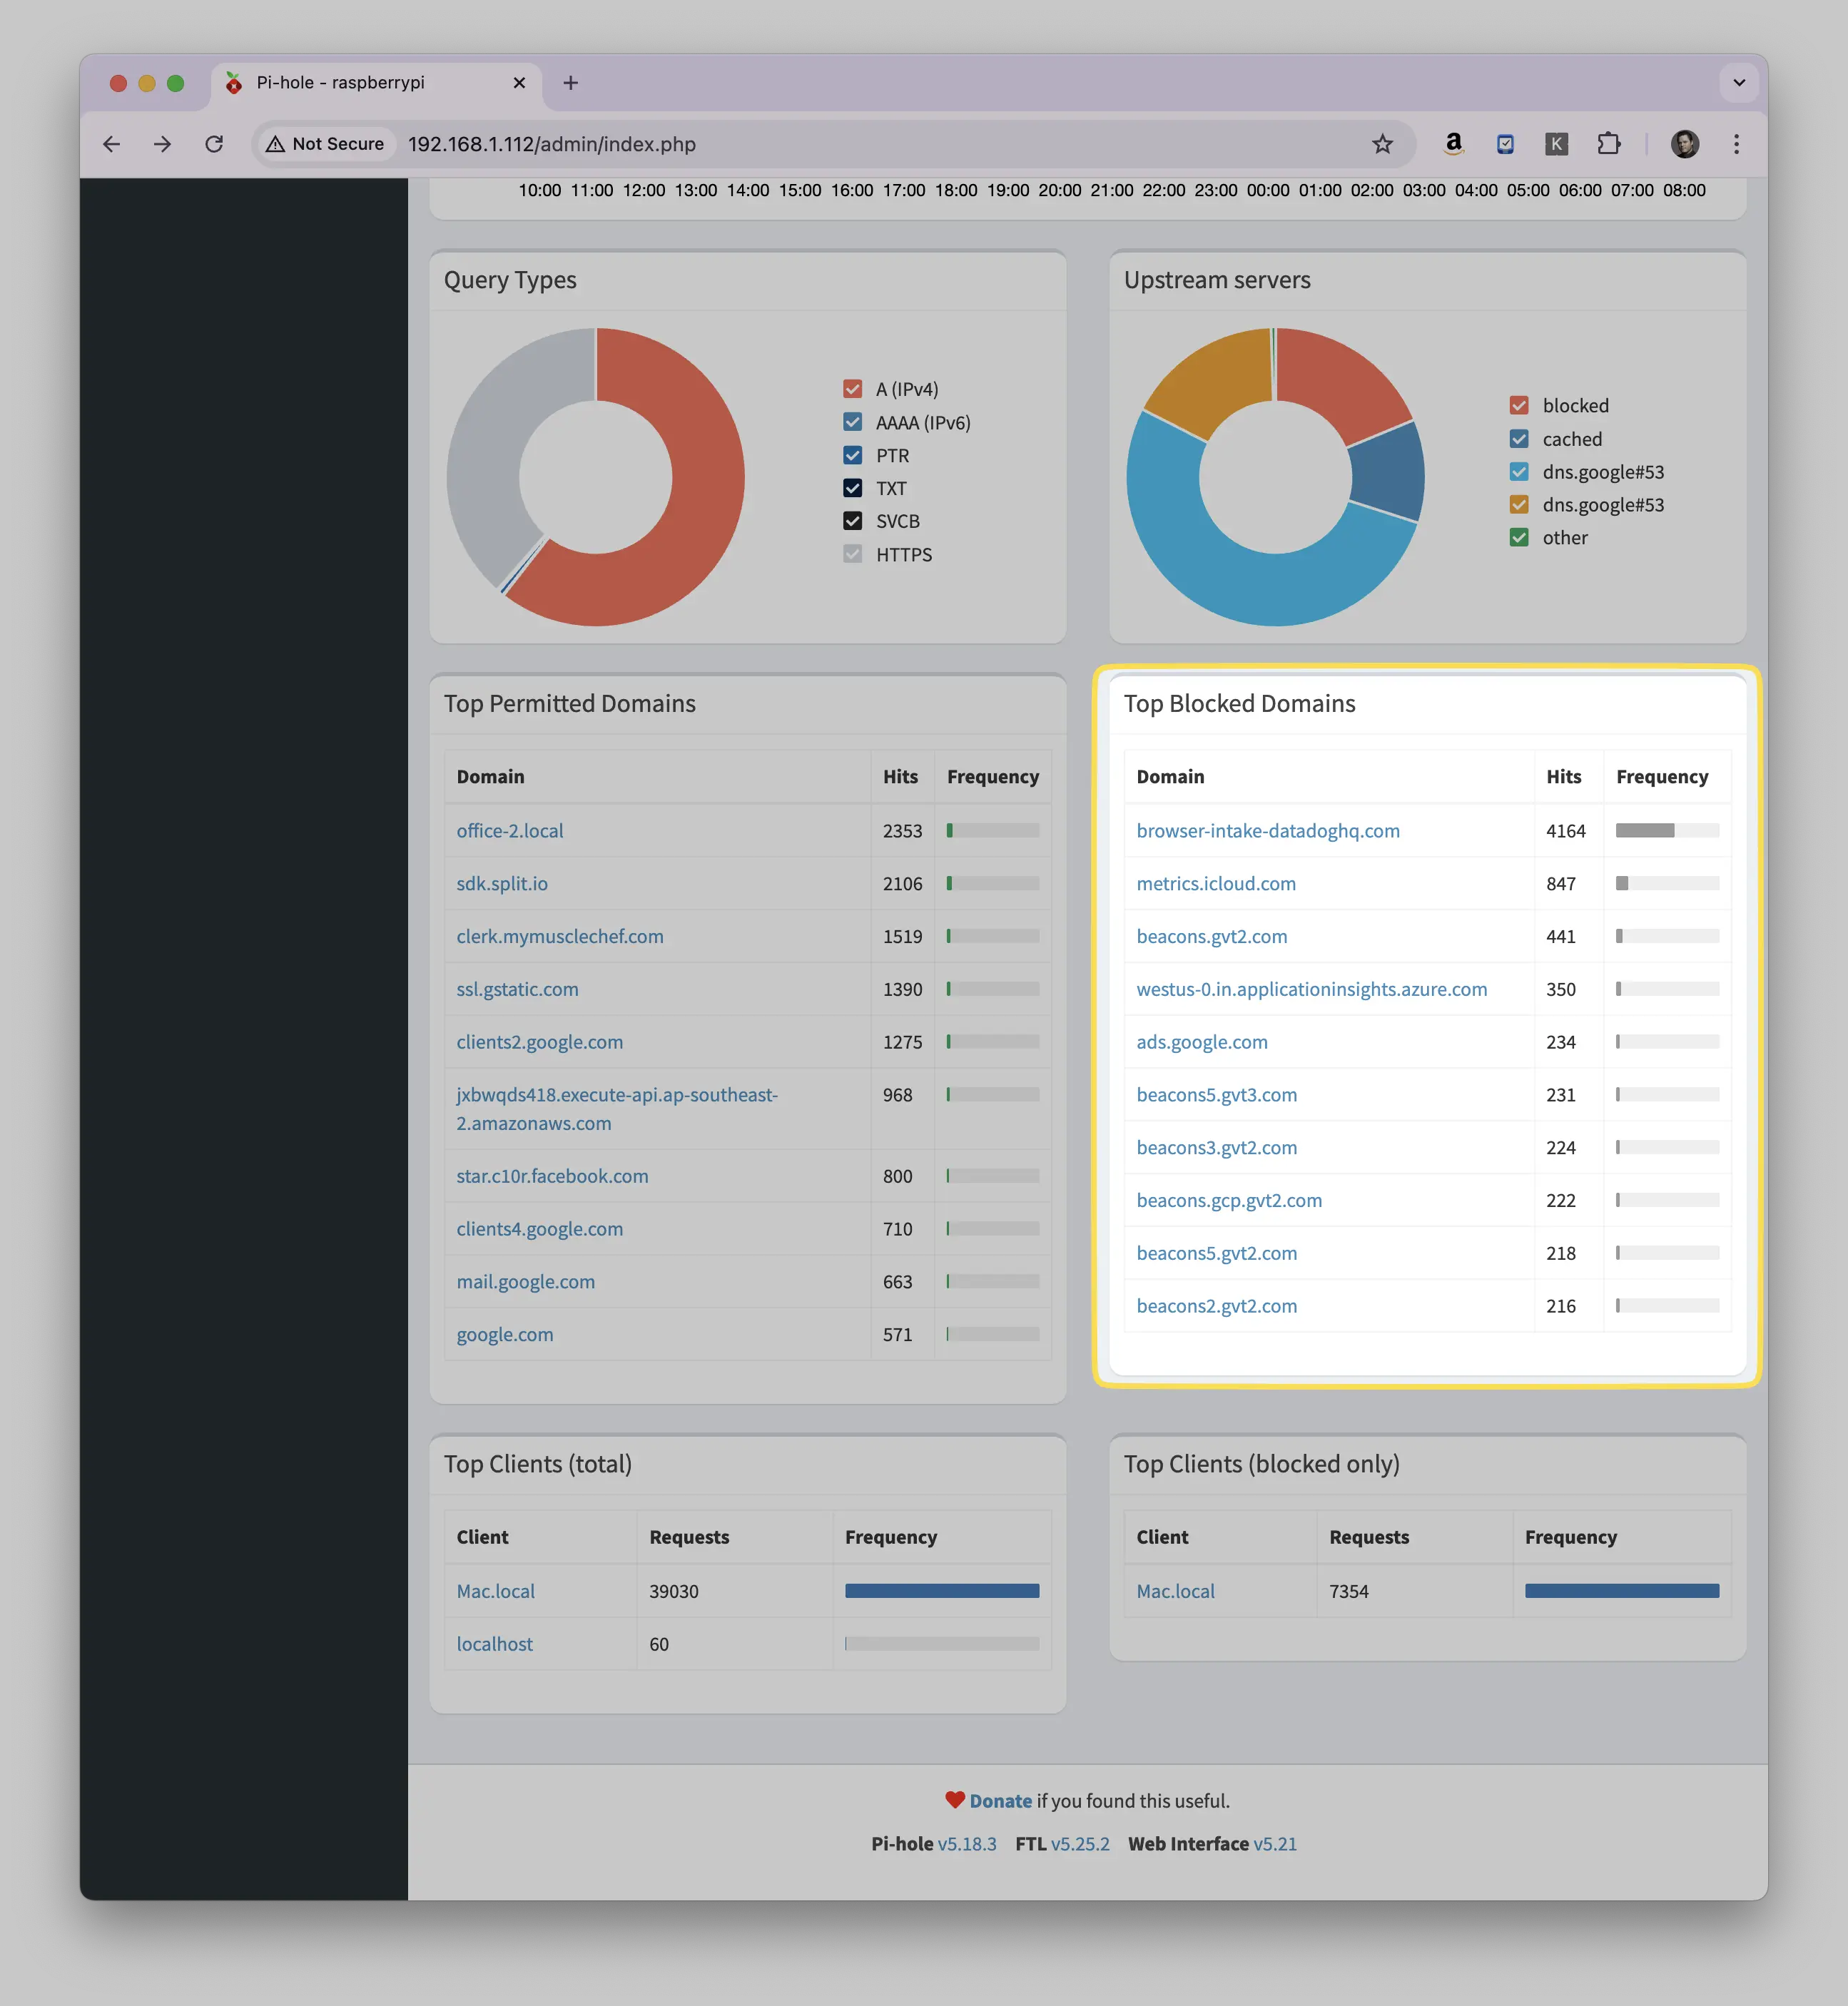
The "Top Blocked Domains" list shows which domains were blocked most frequently by Pi-hole. These are typically advertising, tracking, or potentially unwanted domains that your devices are trying to contact.
Top Clients (total)
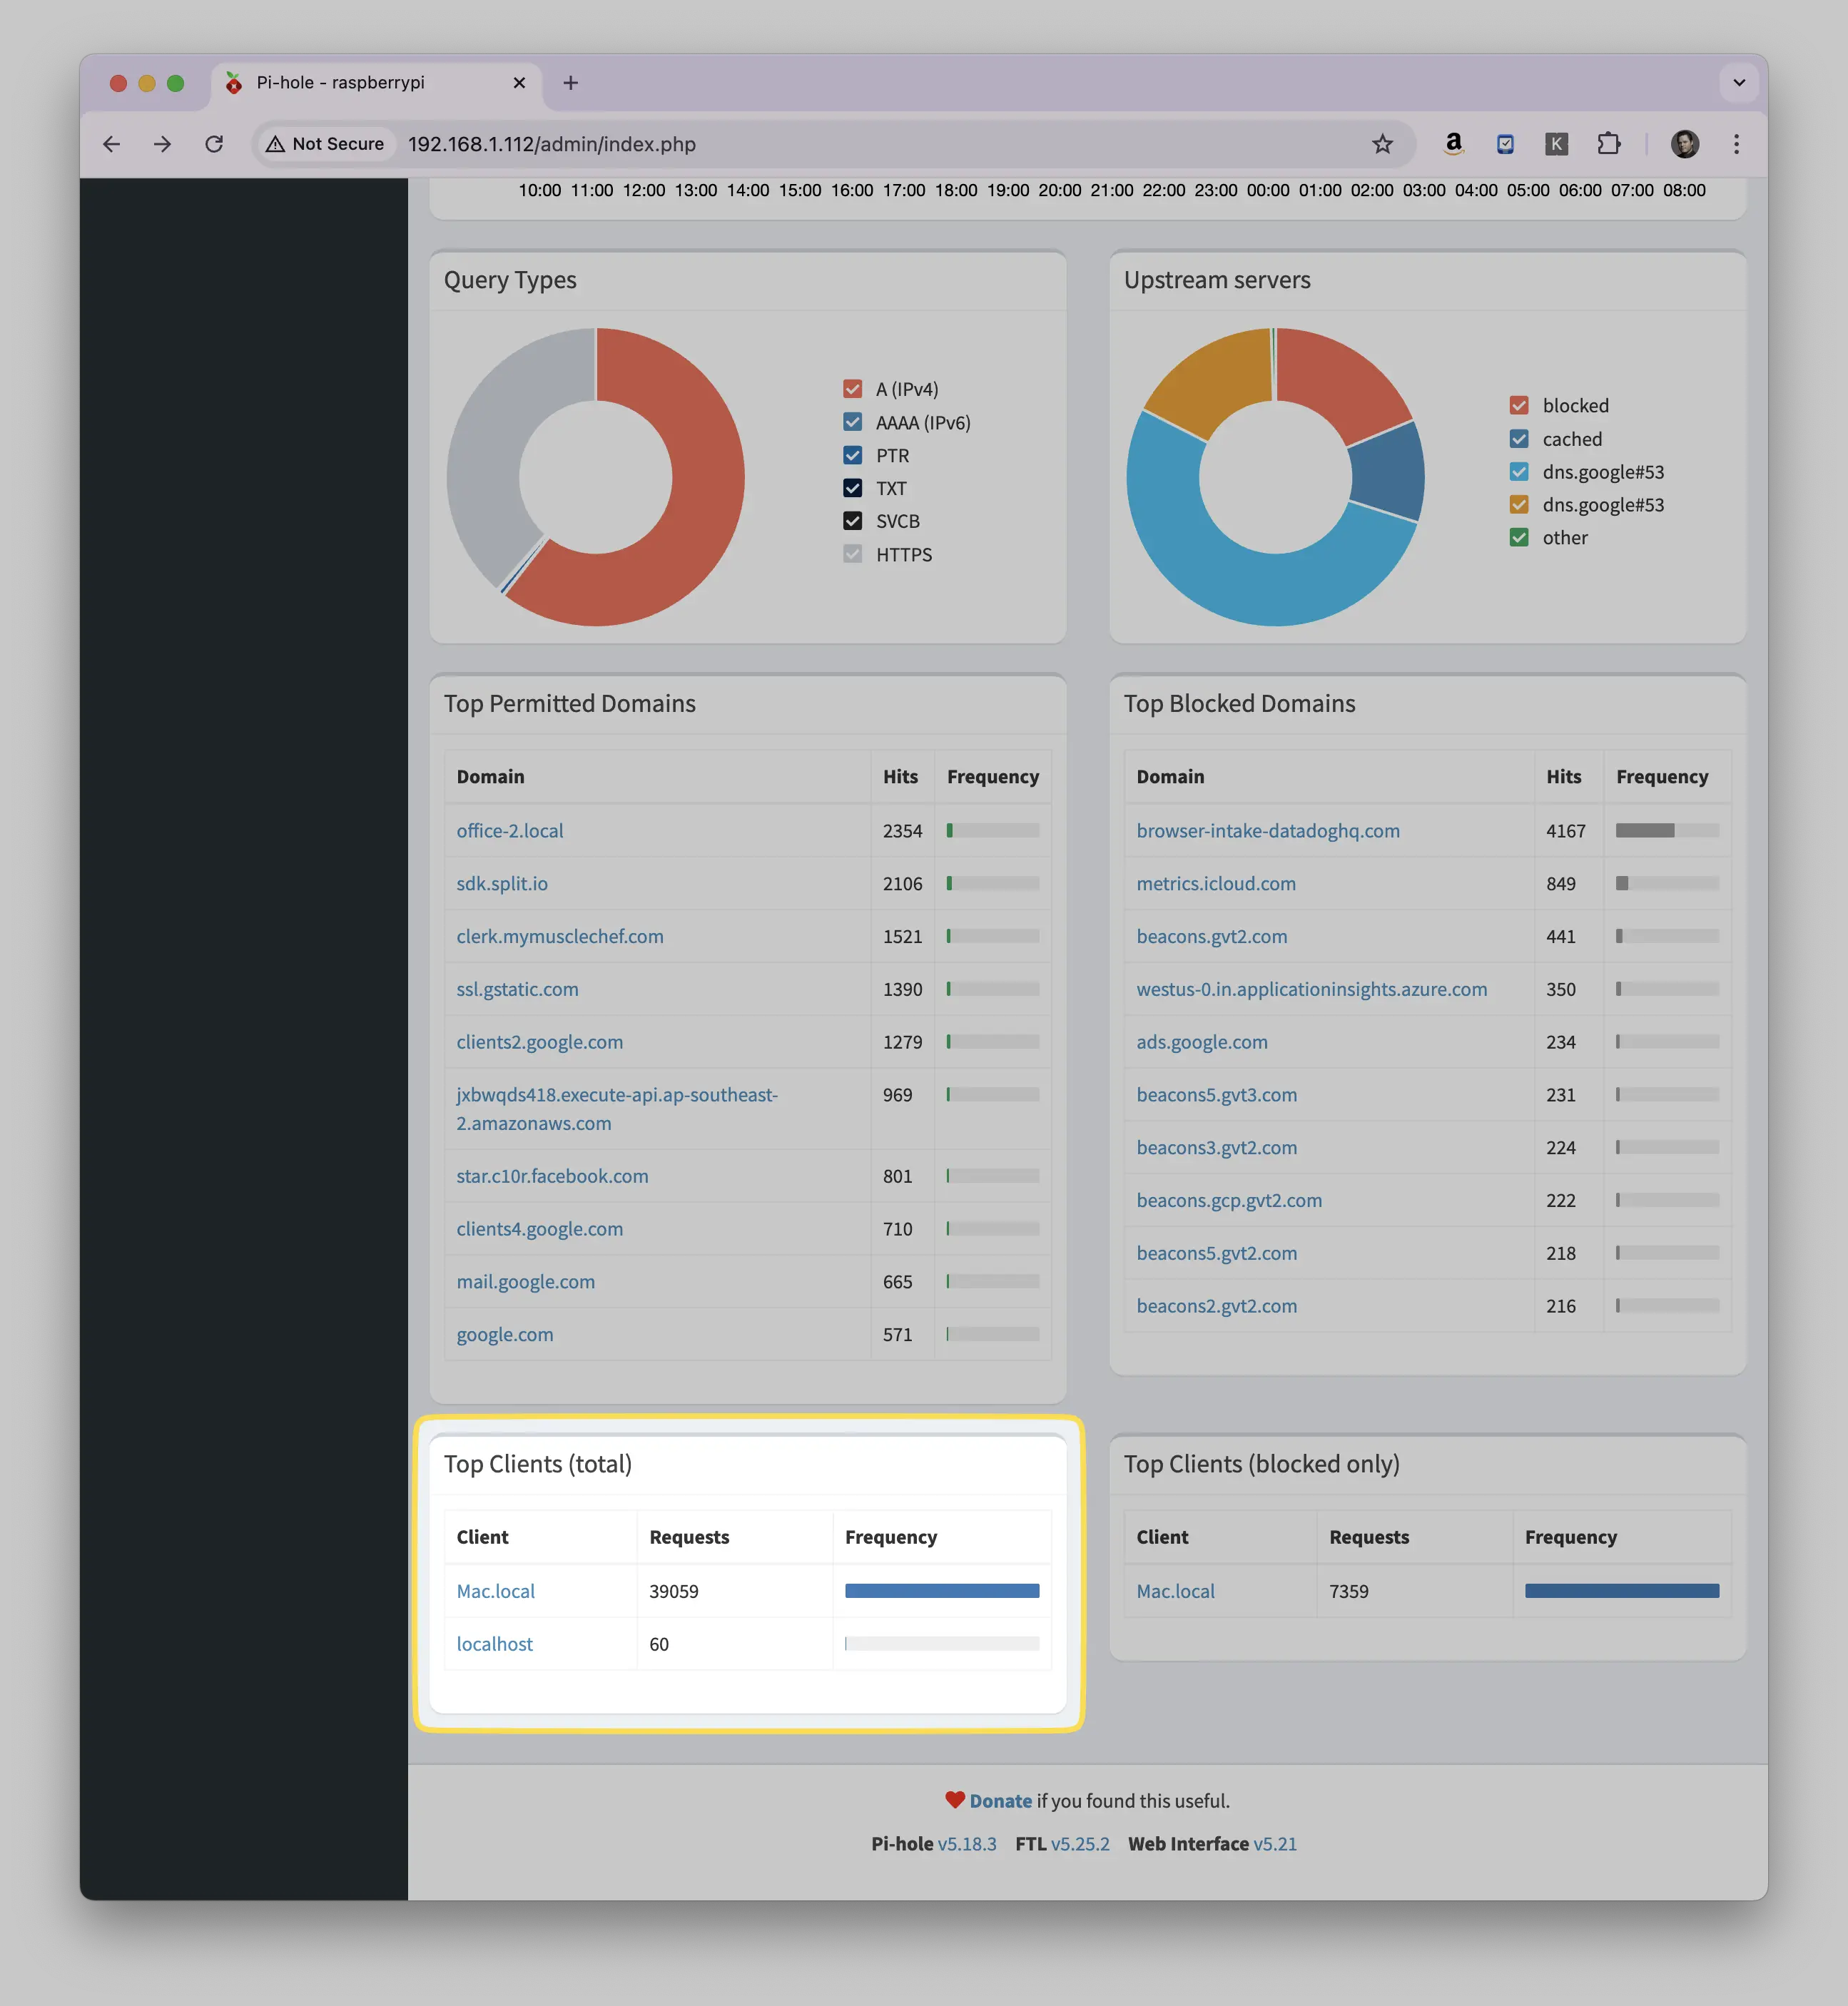
The "Top Clients (total)" list shows which devices on your network are making the most DNS queries overall, both blocked and allowed. This gives you a view of which devices are most active on your network.
Top Clients (blocked only)
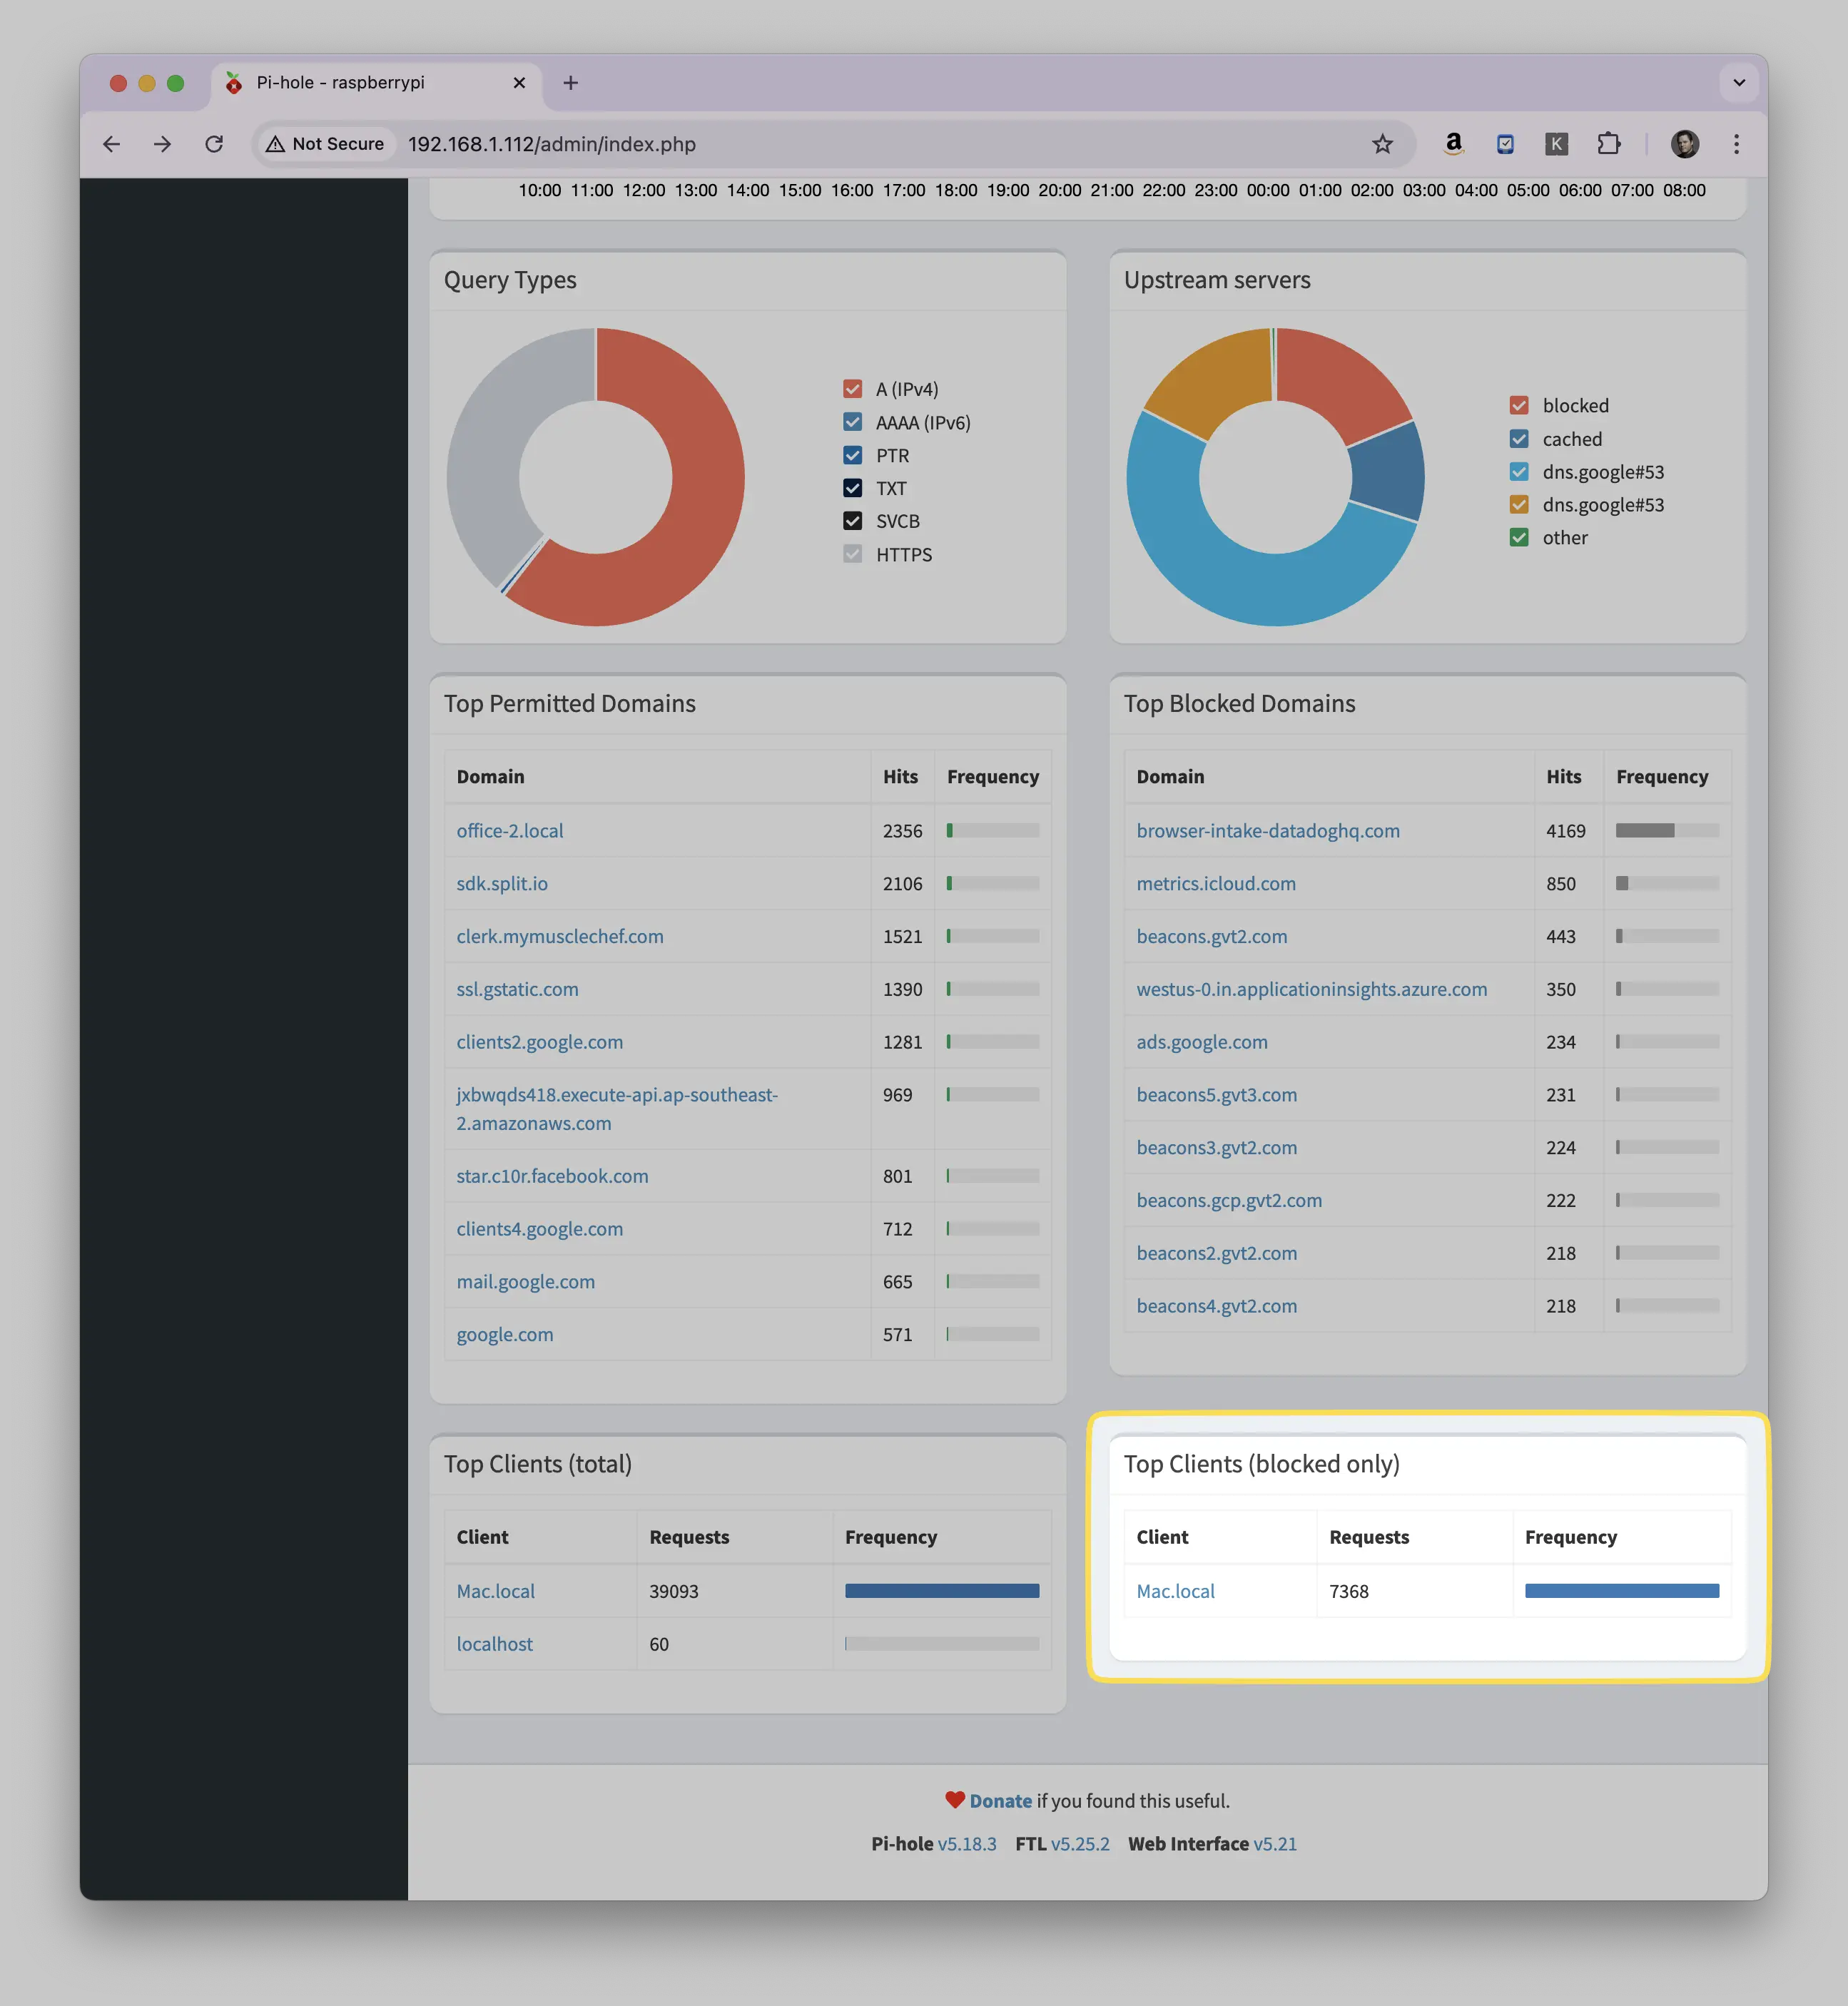 The "Top Clients (blocked only)" list shows which devices on your network had the most blocked DNS queries. This helps you identify which devices are attempting to connect to blocked domains most frequently.
Something here not working for you? Ask in the community — other makers and the Little Bird team read it.